

- October 30, 2026
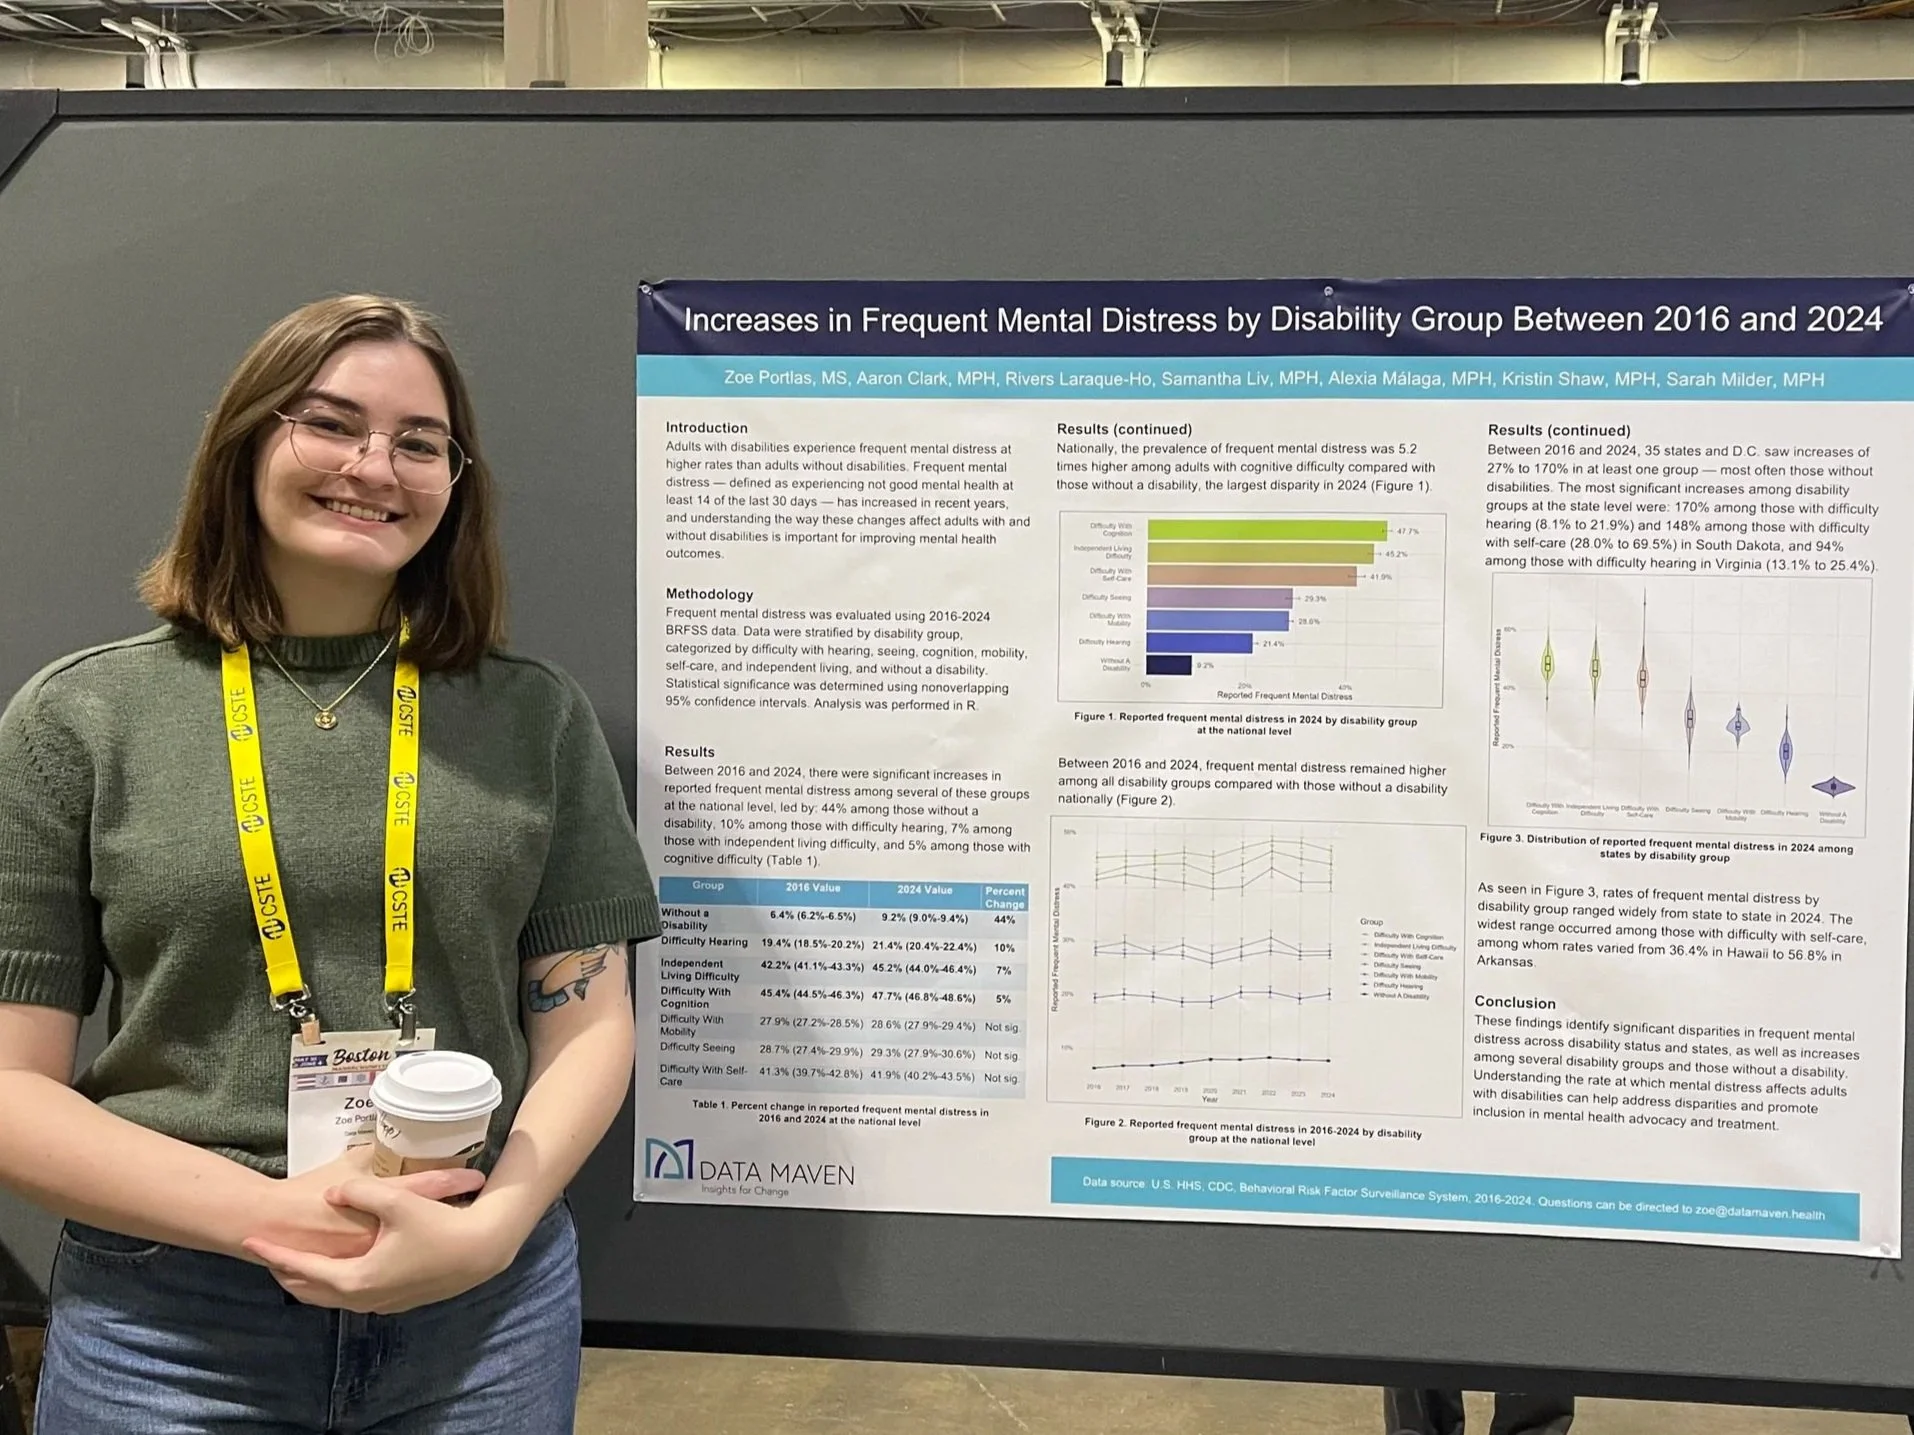
Zoe Portlas, MS presenting her poster on frequent mental distress by disability group at the 2026 CSTE Annual Conference this June in Boston, MA.
Frequent mental distress is a self-reported measure of health-related quality of life. It is based on responses to the question, “[T]hinking about your mental health, which includes stress, depression, and problems with emotions, for how many days during the past 30 days was your mental health not good?” Responses of 14 or more days are classified as frequent mental distress.
This analysis stratified the prevalence of frequent mental distress by specific disability groups — those with hearing, seeing, cognition, mobility, self-care, and independent living disabilities — compared with individuals without disabilities. Significance was assessed using nonoverlapping 95% confidence intervals. The findings reveal striking and consistent disparities throughout the eight-year period.
Between 2016 and 2024, frequent mental distress remained consistently higher among disabled people of all groups compared with those without a disability.
In 2024, the largest national disparity was observed among adults with cognitive difficulty*, who experienced frequent mental distress at a prevalence 5.2 times higher than adults without a disability.
Adults with independent living difficulty were the next highest group and experienced frequent mental distress at a prevalence 4.9 times higher than adults without a disability.
Certain states had particularly pronounced disparities:
In South Dakota, 69.5% [56.5%, 82.4%] of adults with self-care difficulty experienced frequent mental distress, compared with 7.4% [5.4%, 9.4%] of adults without a disability — a 9.4-fold difference.
In Minnesota, frequent mental distress among adults with cognitive difficulty stood at 50.7% [47.3%, 54.1%], compared with 8.1% [7.4%, 8.8%] of adults without a disability — a 6.3-fold difference.
In North Dakota, frequent mental distress among adults with independent living difficulty reached 51.5% [43.9%, 59.1%], compared with 7.1% [6.0%, 8.2%] of adults without a disability — a 7.3-fold difference.
Frequent Mental Distress Is on the Rise
Between 2016 and 2024, reports of frequent mental distress increased significantly across multiple populations nationally:
Adults without a disability experienced a 44% increase in frequent mental distress (rising from 6.4% to 9.2% over eight years).
Adults with hearing difficulty experienced a 10% increase (19.4% to 21.4%).
Adults with independent living difficulty experienced a 7% increase (42.2% to 45.2%).
Adults with cognitive difficulty experienced a 5% increase (45.4% to 47.7%).
State-level trends highlight even sharper shifts. Across 35 states and Washington, D.C., frequent mental distress increased between 27% and 170% in at least one subgroup, most frequently among adults without disabilities. However, the prevalence of frequent mental distress remained significantly higher among disabled adults, and certain disability groups also experienced large increases in frequent mental distress between 2016 and 2024:
South Dakota recorded a 170% increase among adults with hearing difficulty (8.1% to 21.9%) and a 148% increase among adults with self-care difficulty (28.0% to 69.5%).
Virginia saw a 94% increase among adults with hearing difficulty (13.1% to 25.4%).
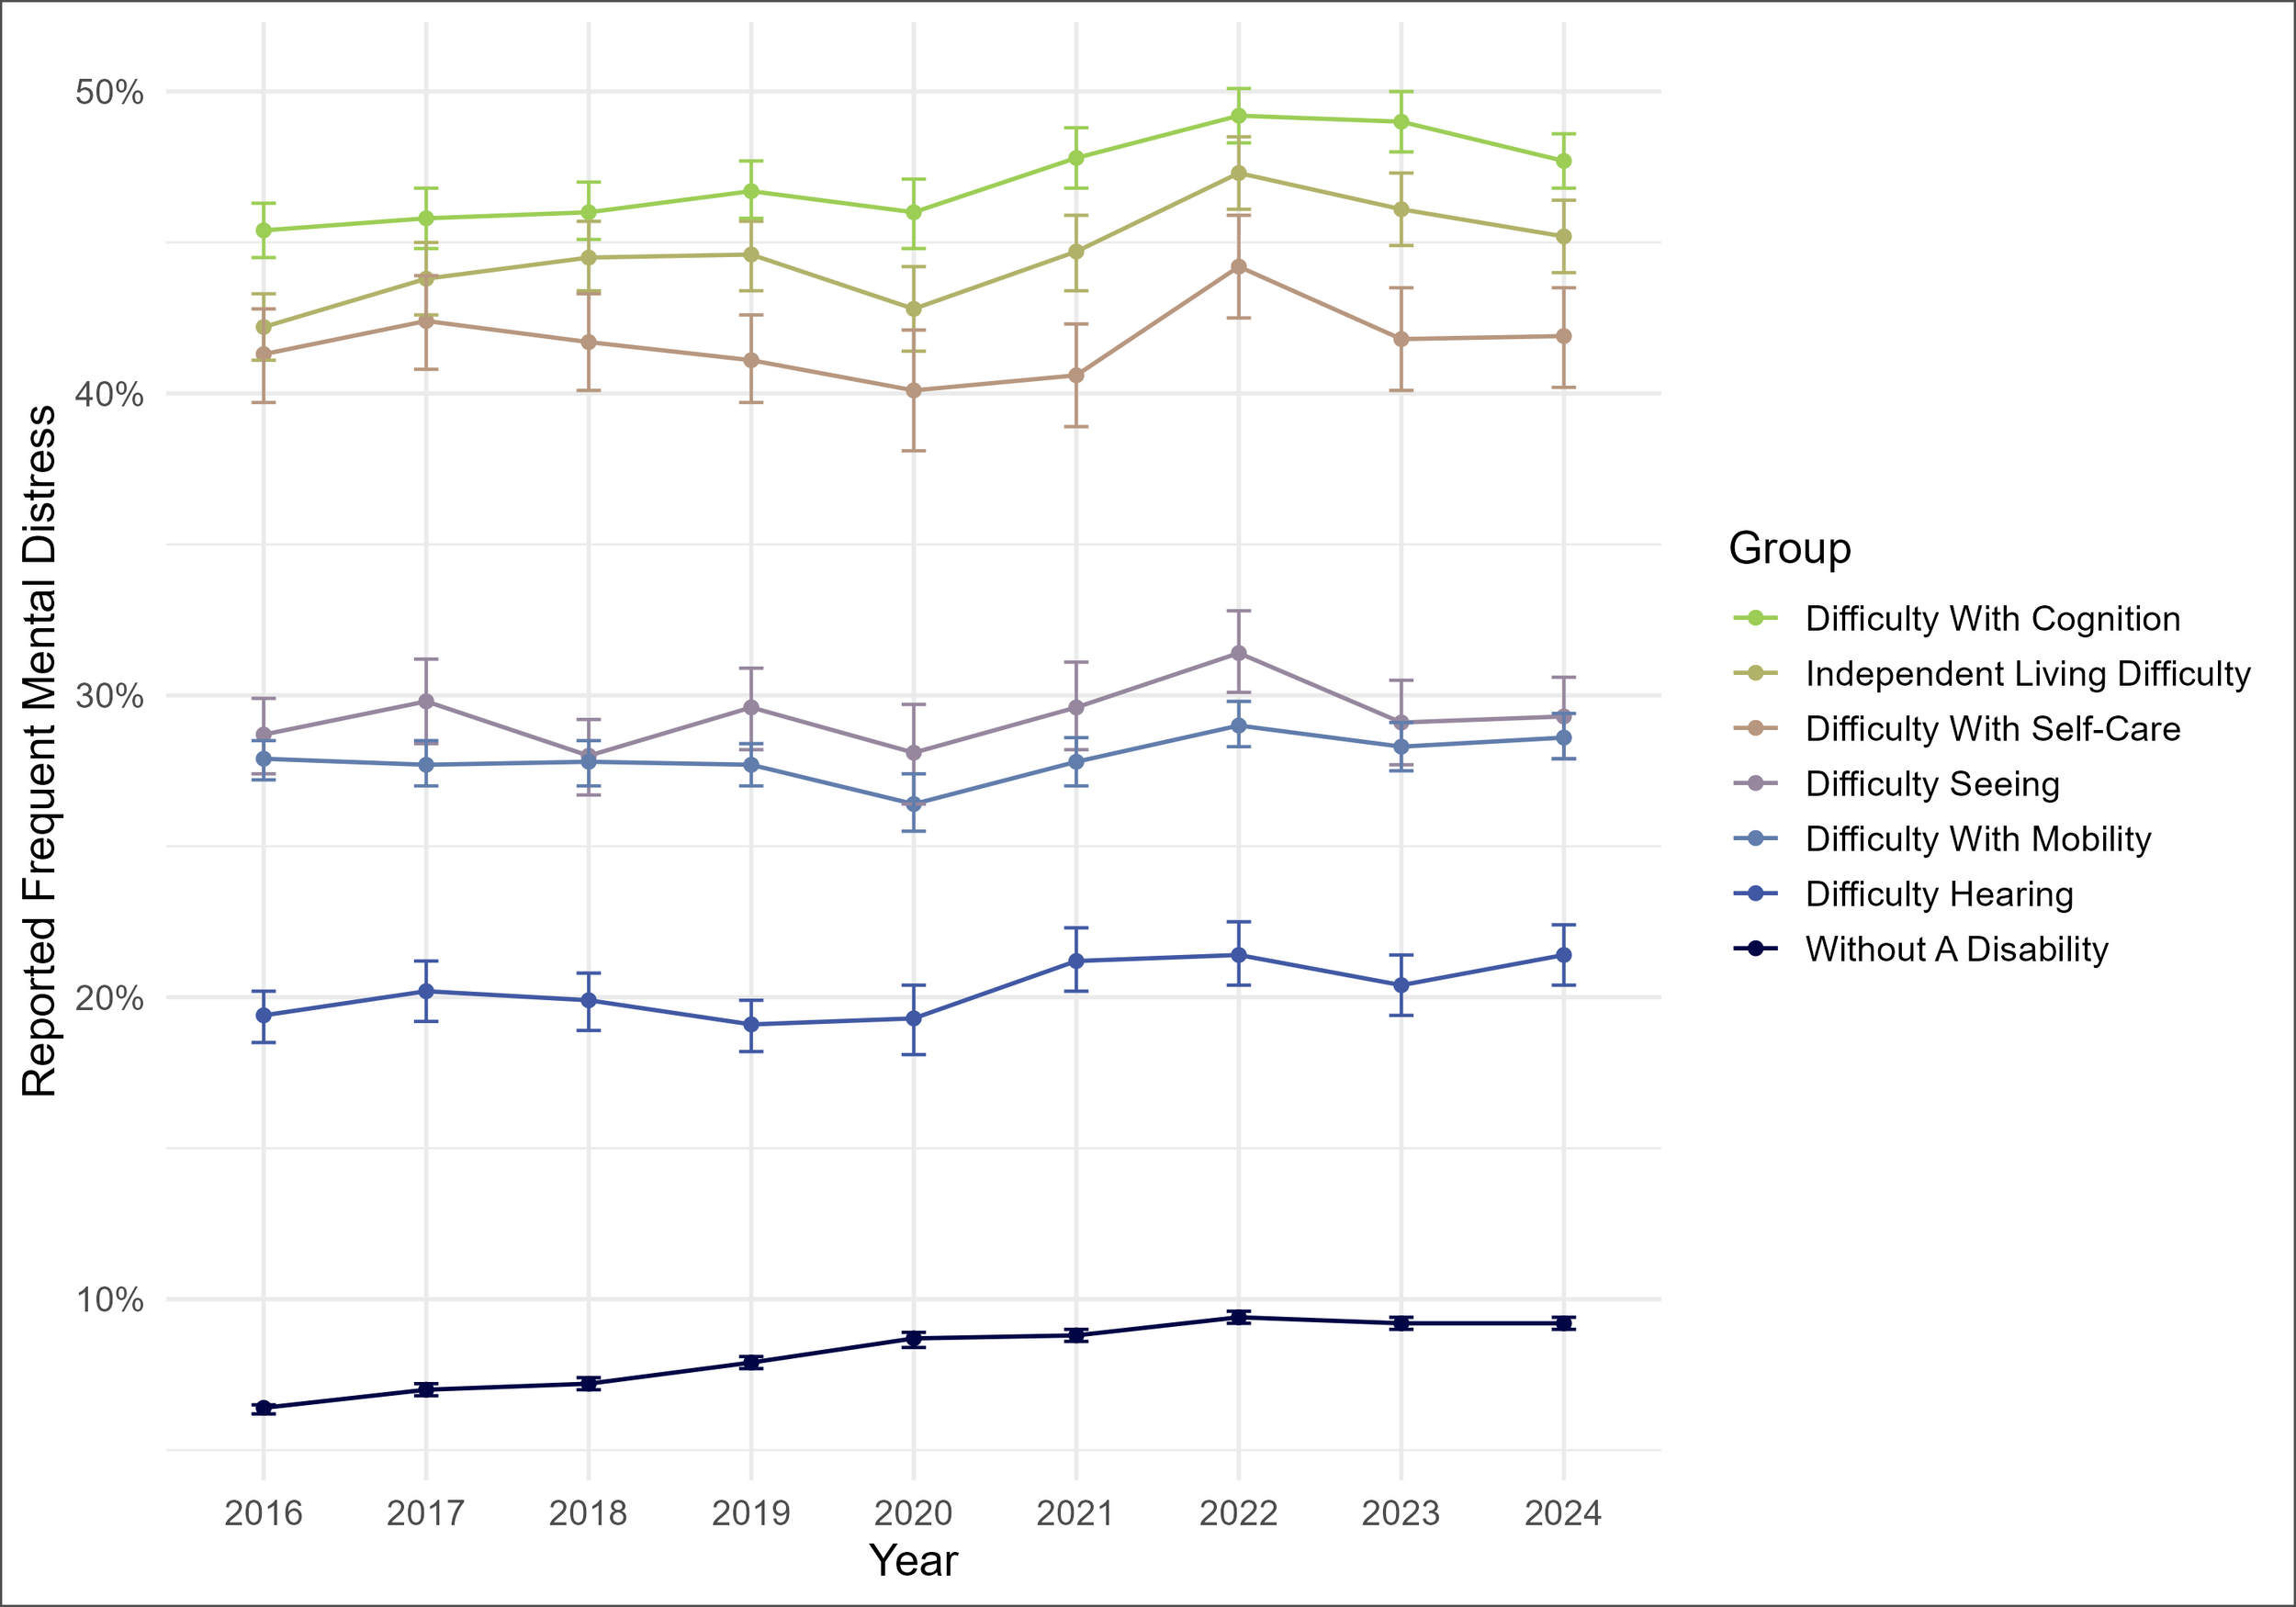
Figure 1. Frequent Mental Distress Among Adults in the United States, by Disability Group, 2016–2024
What This Means for Public Health
Depression and mental health disorders stem from complex biological, psychological, genetic, and environmental factors. Because depression manifests differently in every individual, early identification through screening is essential. Our findings point to two problems that call for different responses.
First, frequent mental distress is rising across the board, demanding large-scale prevention efforts which calls for population-wide prevention. Second, adults with disabilities continue to experience a higher prevalence of frequent mental distress. Closing that gap means recognizing that “disability” is not one population. The barriers facing an adult with hearing difficulty differ from those facing an adult with cognitive or self-care difficulty. Screening tools, crisis lines, and care pathways need to work without a phone call, in plain language, and in the home settings where people with self-care and independent living difficulties already receive support.
It also means measuring disability in more detail. Surveillance and needs assessments that use a single “any disability” category can mask the groups at greatest risk. Breaking BRFSS and state survey data out by disability type, and interpreting small-subgroup estimates carefully, helps public health leaders direct resources to where the need is largest.
These BRFSS findings underline that persistent mental distress disproportionately impacts adults with disabilities, demanding targeted action. Understanding these disparities helps public health leaders to allocate resources strategically and design accessible mental health advocacy, screening, and treatment systems to advance health equity.
*Note: Cognitive difficulty and frequent mental distress have significant conceptual and clinical overlap, as cognitive symptoms (e.g., difficulty concentrating or making decisions) can be both a symptom and a consequence of frequent mental distress.
View Zoe’s full abstract and poster here.
Data Maven is a women-owned public health consulting firm with nearly 20 years of experience turning complex datasets into clear, actionable insights, tailored reports, health indices, and custom health tools. Whether you’re a public agency, nonprofit, foundation, or research team, let us bring our analytic expertise to your next project.
References
Centers for Disease Control and Prevention. Measuring Healthy Days: Population Assessment of Health-Related Quality of Life. Atlanta, GA: U.S. Department of Health and Human Services, Centers for Disease Control and Prevention, National Center for Chronic Disease Prevention and Health Promotion, Division of Adult and Community Health, November 2000. https://stacks.cdc.gov/view/cdc/6406.
