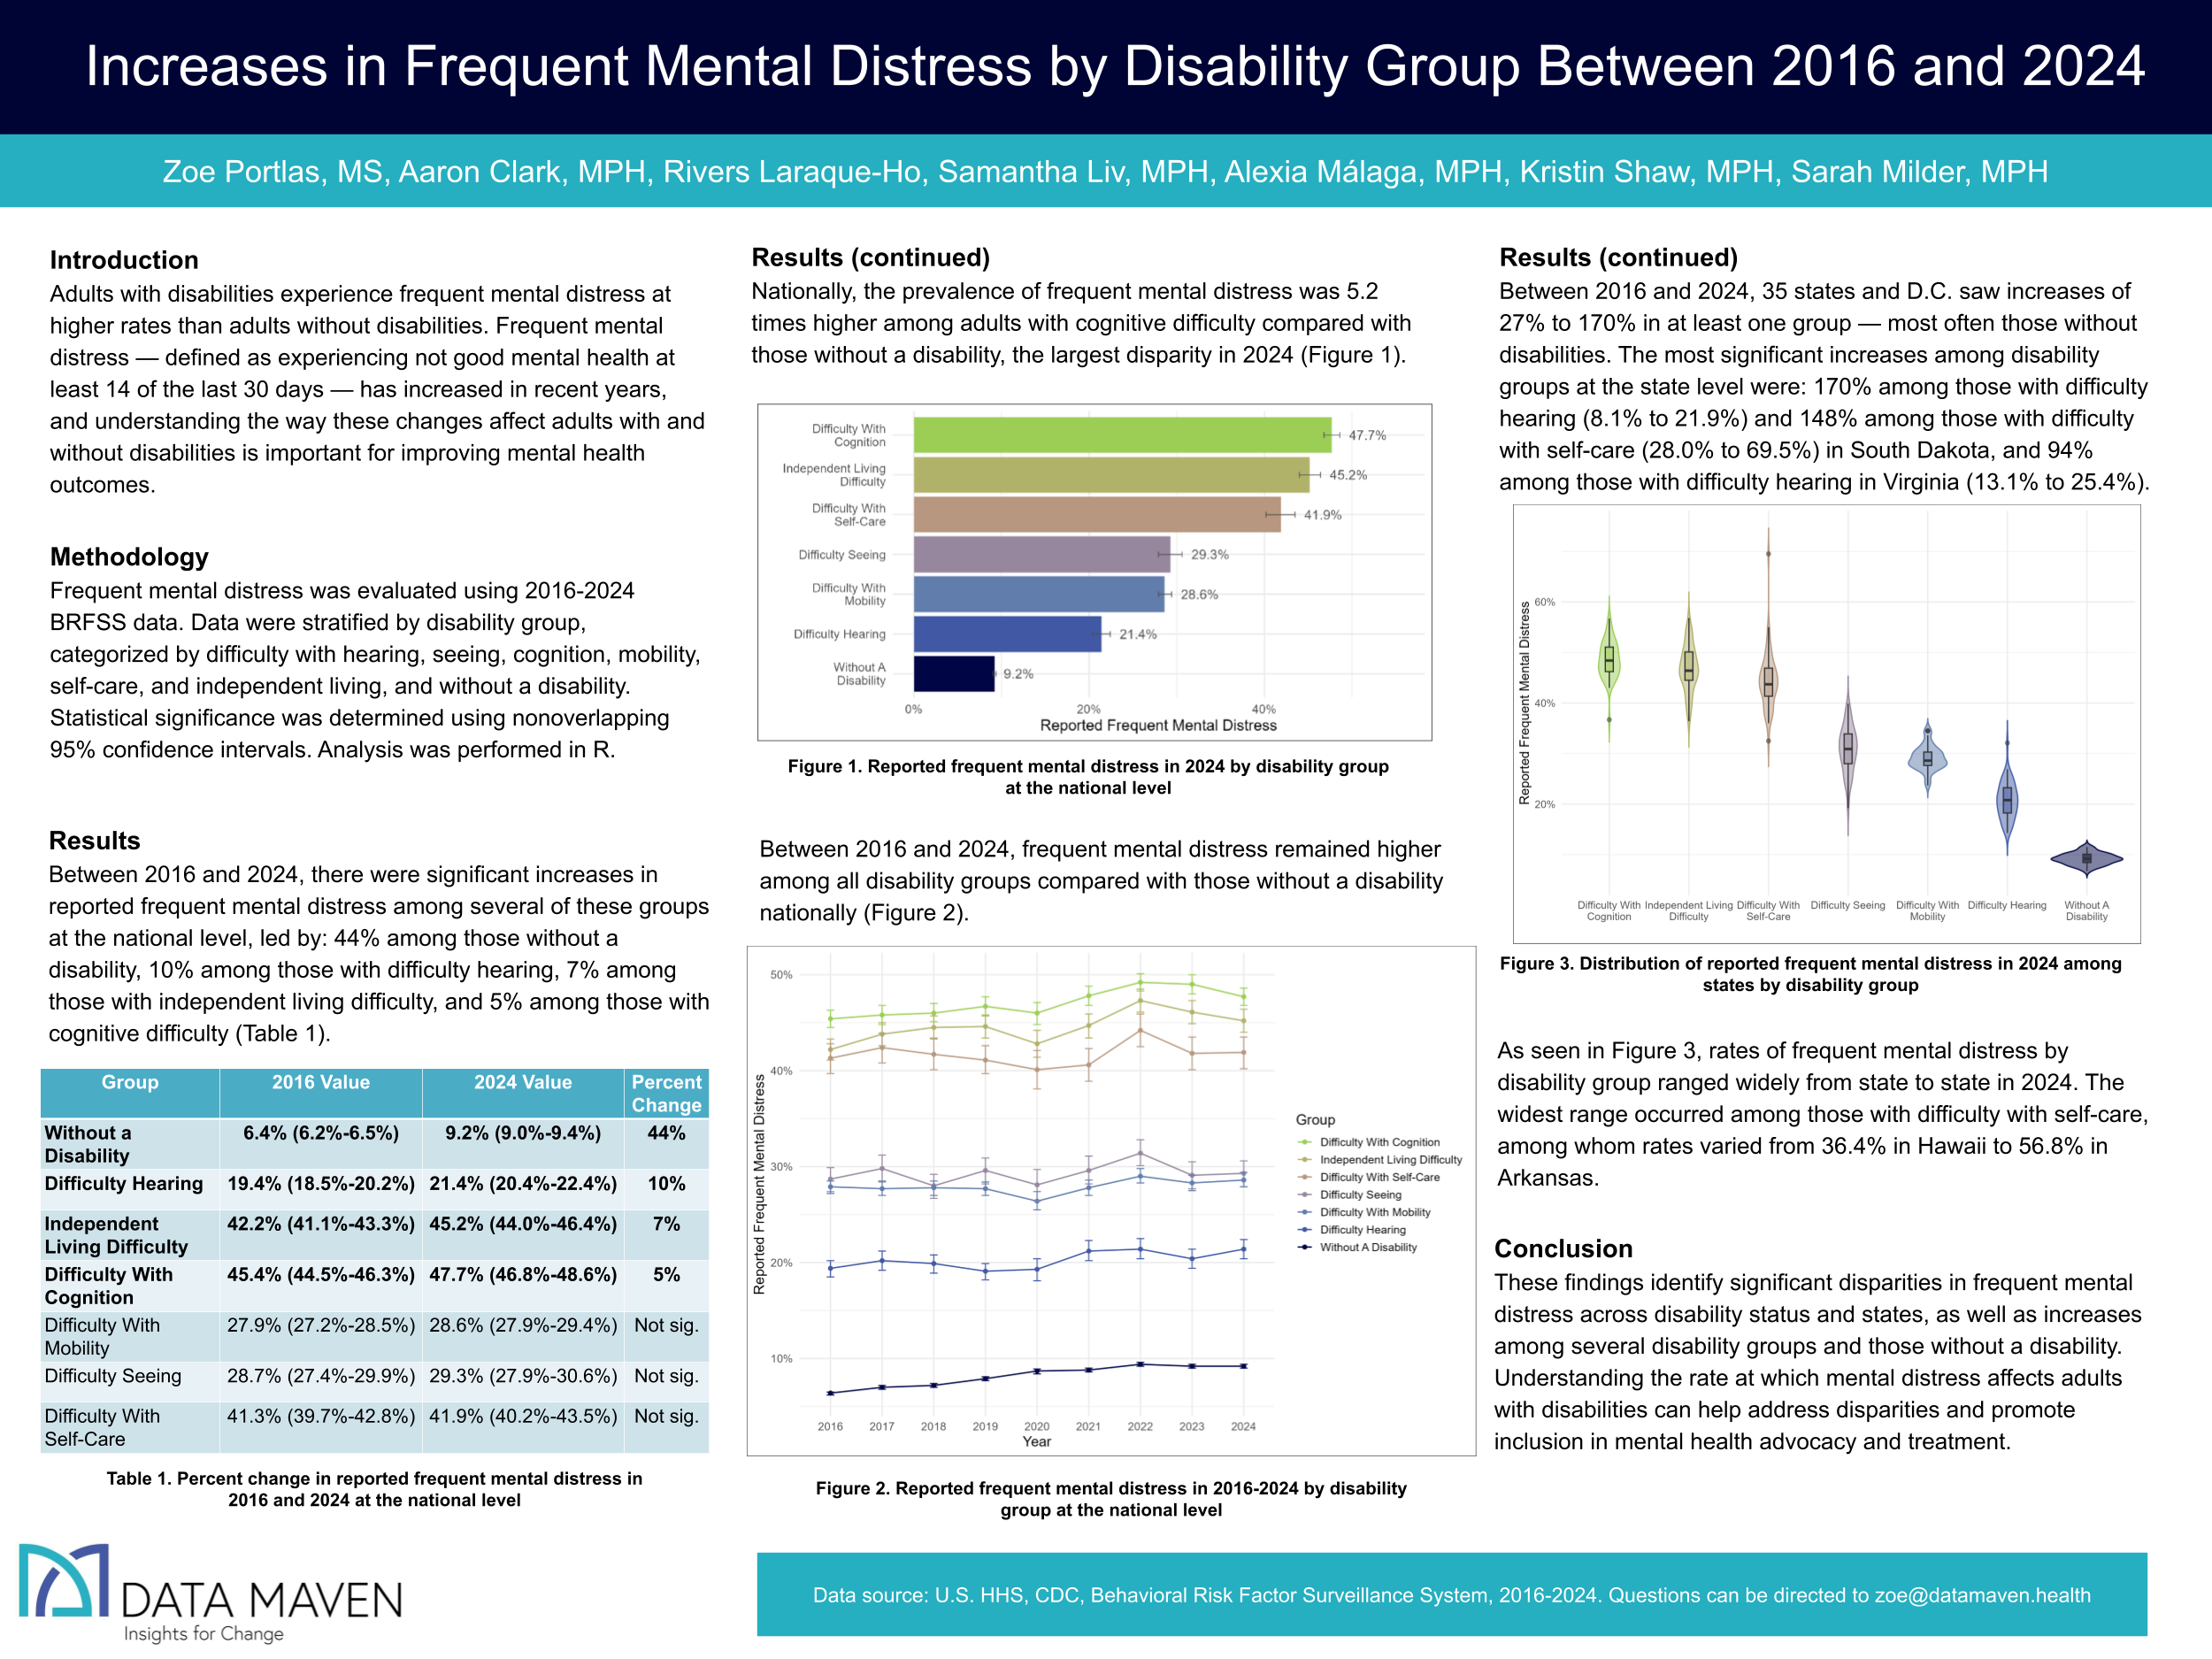
Increases in Reported Frequent Mental Distress by Disability Group Between 2016 and 2024
Zoe Portlas • 2026 CSTE Annual Conference
Zoe Portlas
2026 Council of State and Territorial Epidemiologists (CSTE) Annual Conference • Boston, MA
Background
Adults with disabilities experience frequent mental distress at higher rates than adults without disabilities. Frequent mental distress, defined as reporting/having not good mental health at least 14 of the last 30 days, has increased in recent years, and understanding the way these changes affect adults with and without disabilities is important for improving mental health outcomes.
Methods
Frequent mental distress was evaluated using 2016-2024 BRFSS data. Data were stratified by disability group, including difficulty with hearing, seeing, cognition, mobility, self-care, and independent living, and without a disability. Statistical significance was determined using nonoverlapping 95% confidence intervals. Analysis was performed in R.
Results
From 2016 to 2024, frequent mental distress remained higher among all disability groups compared with those without a disability in the United States. The prevalence of frequent mental distress was 5.2 times higher among those with cognitive difficulty compared with no disability, the largest disparity in 2024. At the state level, the highest disparities were: 13.6 times higher among those with self-care difficulty (69.5%) compared with no disability (5.1%) in South Dakota, 11.4 times higher among those with cognitive difficulty (51.3%) compared with no disability (4.5%) in Minnesota, and 10.9 times higher among those with independent living difficulty (52.3%) compared with no disability (4.8%) in North Dakota.
Between 2016 and 2024, there were significant increases in reported frequent mental distress among several of these groups, led by: 44% among those without a disability (6.4% to 9.2%), 10% among those with difficulty hearing (19.4% to 21.4%), 7% among those with independent living difficulty (42.2% to 45.2%), and 5% among those with cognitive difficulty (45.4% to 47.7%).
Between 2016 and 2024, 35 states and D.C. saw increases between 27% and 170% in at least one group, most often those without disabilities. The most significant increases among disability groups at the state level were: 170% among those with difficulty hearing (8.1% to 21.9%) and 148% among those with self-care difficulty (28.0% to 69.5%) in South Dakota and 94% among those with difficulty hearing (13.1% to 25.4%) in Virginia.
Conclusions and Public Health Impact
These findings identify significant disparities in frequent mental distress across disability status and states. Understanding the rate at which mental distress affects adults with disabilities can help address disparities and promote inclusion in mental health advocacy and treatment.
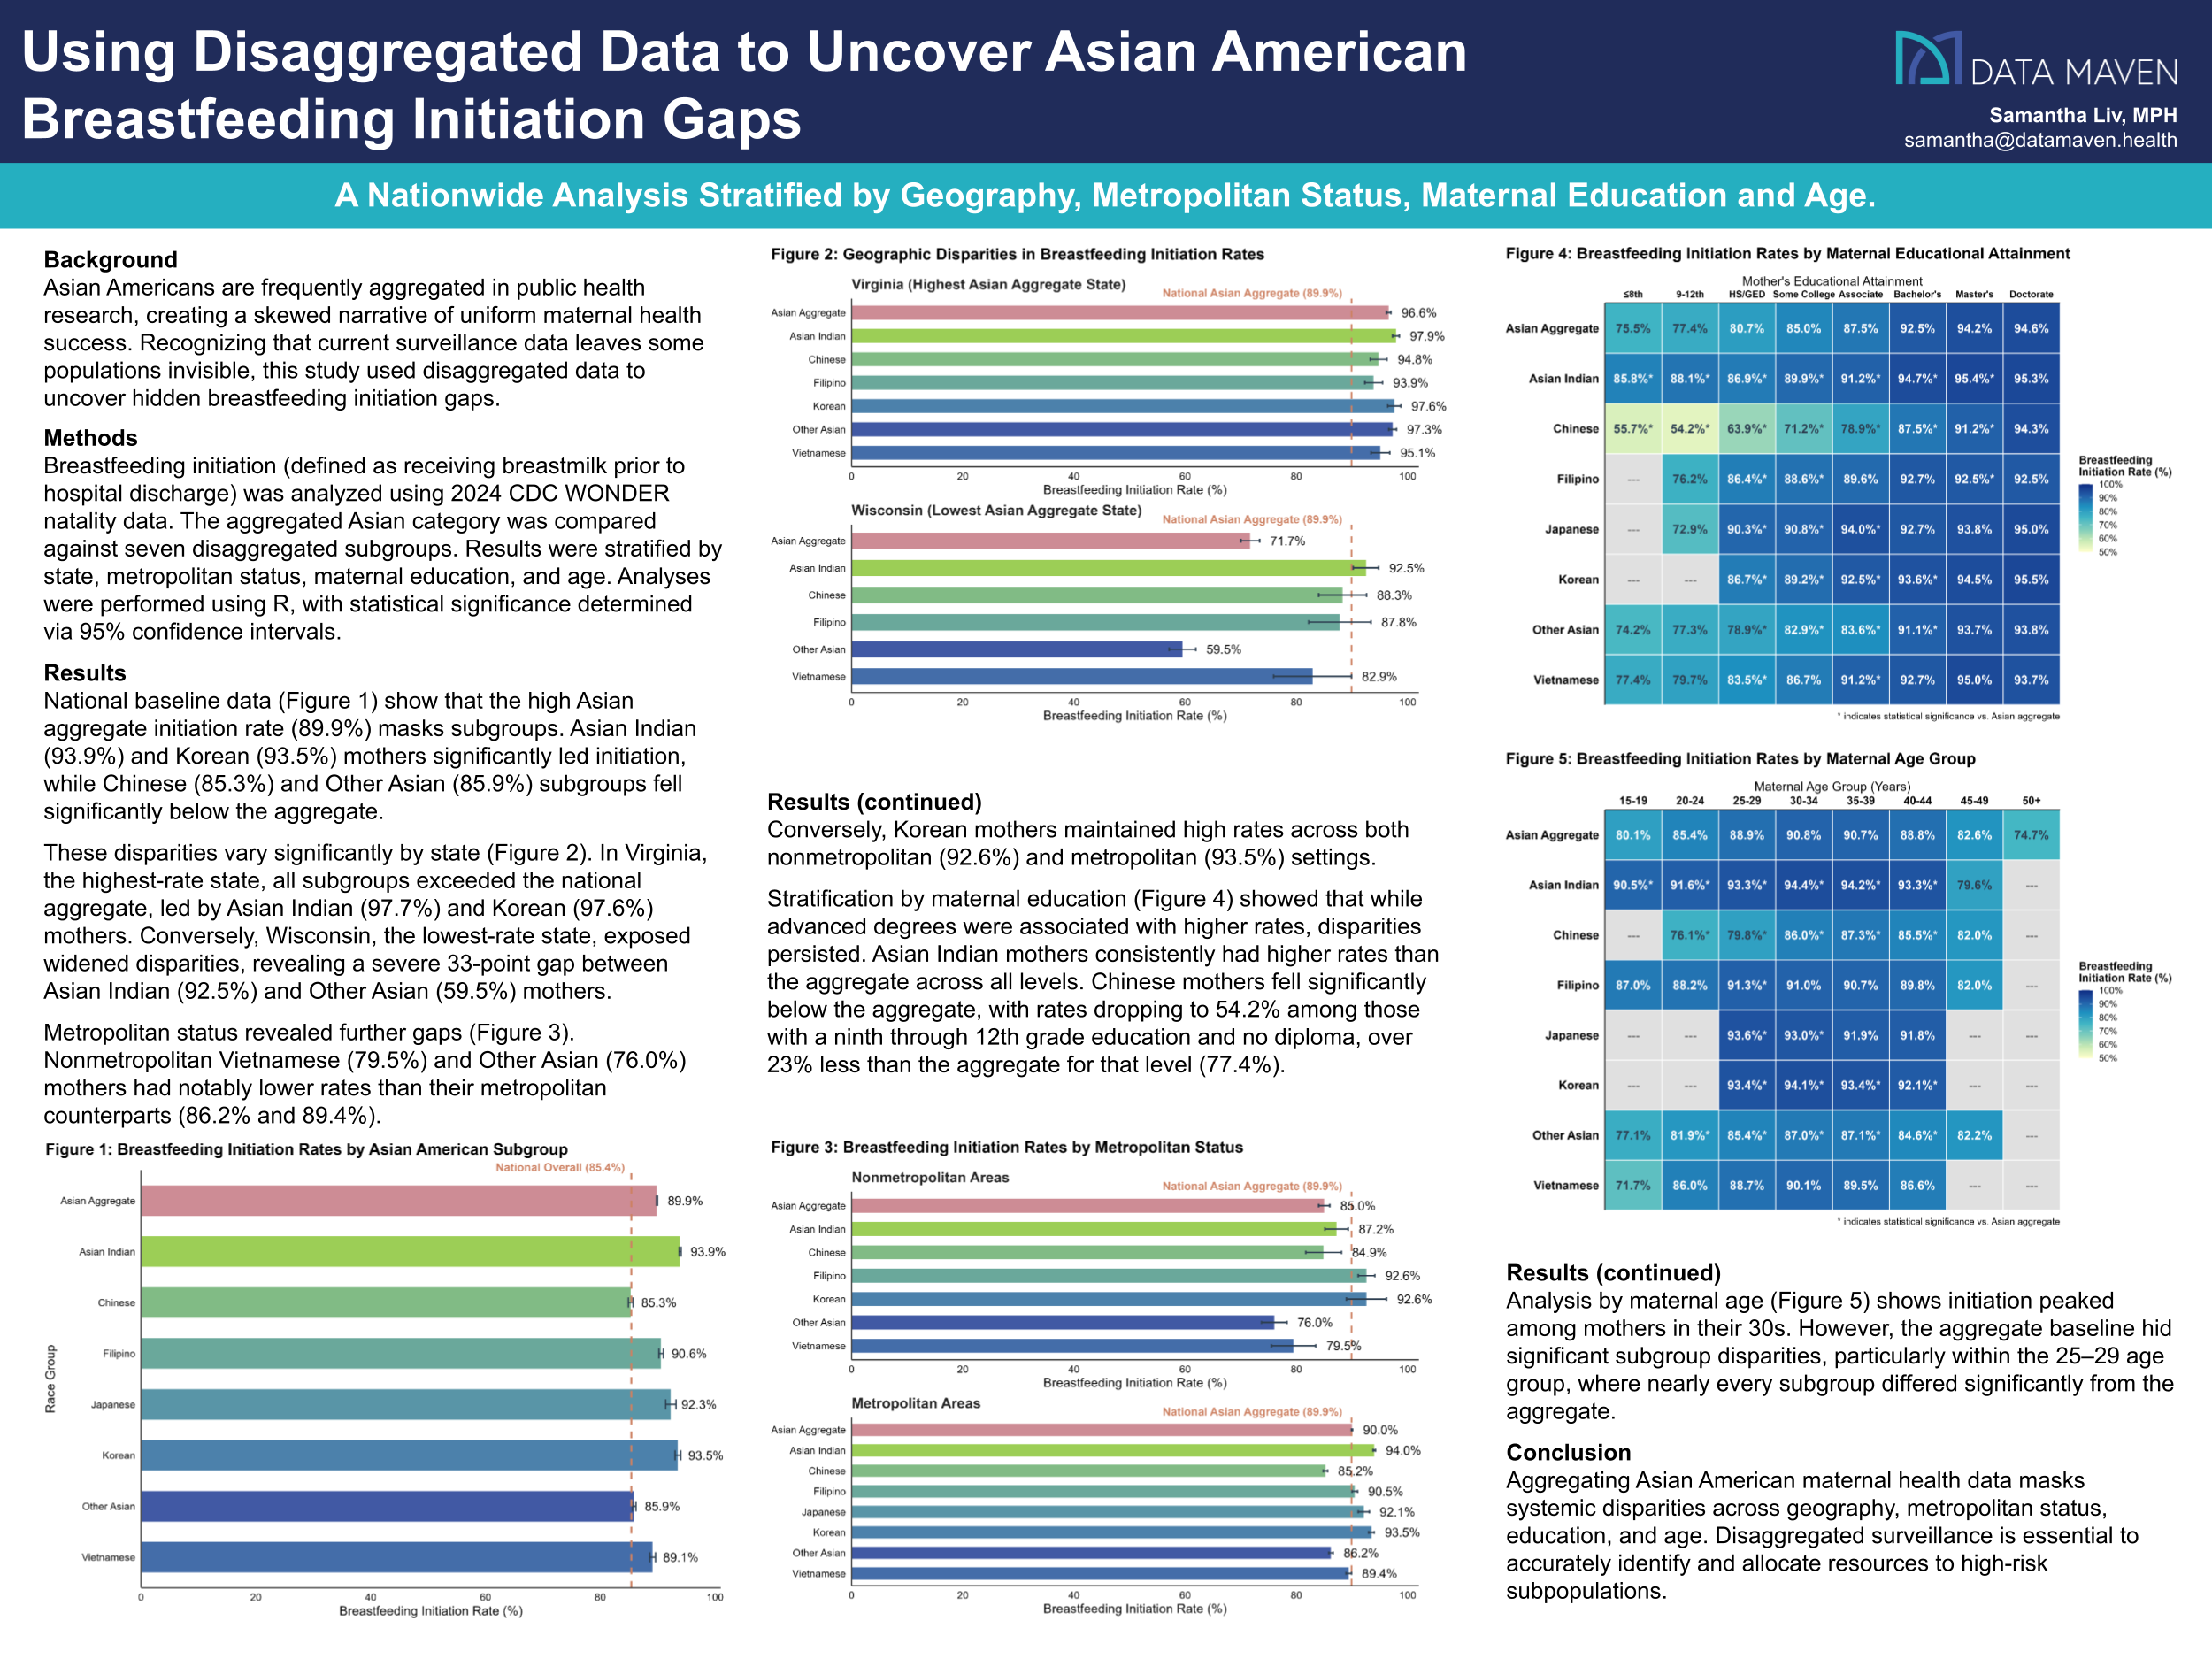
Using Disaggregated Data to Uncover Asian American Breastfeeding Initiation Gaps
Samantha Liv • 2026 CSTE Annual Conference
Samantha Liv
2026 Council of State and Territorial Epidemiologists (CSTE) Annual Conference • Boston, MA
Background
Asian Americans are frequently aggregated in public health research, creating a skewed narrative of uniform maternal health success. Recognizing that current surveillance data leaves some populations invisible, this study used disaggregated data to uncover hidden breastfeeding initiation gaps.
Methods
Breastfeeding initiation (defined as receiving breast milk prior to hospital discharge) was analyzed using 2024 CDC WONDER natality data. The aggregated Asian category was compared against seven disaggregated subgroups. Results were stratified by state, metropolitan status, maternal education, and age. Analyses were performed using R, with statistical significance determined via 95% confidence intervals.
Results
National baseline data show that the high Asian aggregate initiation rate (89.9%) masks subgroups. Asian Indian (93.9%) and Korean (93.5%) mothers significantly led initiation, while Chinese (85.3%) and Other Asian (85.9%) subgroups fell significantly below the aggregate.
These disparities vary significantly by state. In Virginia, the highest-rate state, all subgroups exceeded the national aggregate, led by Asian Indian (97.7%) and Korean (97.6%) mothers. Conversely, Wisconsin, the lowest-rate state, exposed widened disparities, revealing a severe 33-point gap between Asian Indian (92.5%) and Other Asian (59.5%) mothers.
Metropolitan status revealed further gaps. Nonmetropolitan Vietnamese (79.5%) and Other Asian (76.0%) mothers had notably lower rates than their metropolitan counterparts (86.2% and 89.4%). Conversely, Korean mothers maintained high rates across both nonmetropolitan (92.6%) and metropolitan (93.5%) settings.
Stratification by maternal education showed that while advanced degrees were associated with higher rates, disparities persisted. Asian Indian mothers consistently had higher rates than the aggregate across all levels. Chinese mothers fell significantly below the aggregate, with rates dropping to 54.2% among those with a ninth through 12th grade education and no diploma, over 23% less than the aggregate for that level (77.4%).
Analysis by maternal age shows initiation peaked among mothers in their 30s. However, the aggregate baseline hid significant subgroup disparities, particularly within the 25–29 age group, where nearly every subgroup differed significantly from the aggregate.
Conclusions and Public Health Impact
Aggregating Asian American maternal health data masks systemic disparities across geography, metropolitan status, education, and age. Disaggregated surveillance is essential to accurately identify and allocate resources to high-risk subpopulations.
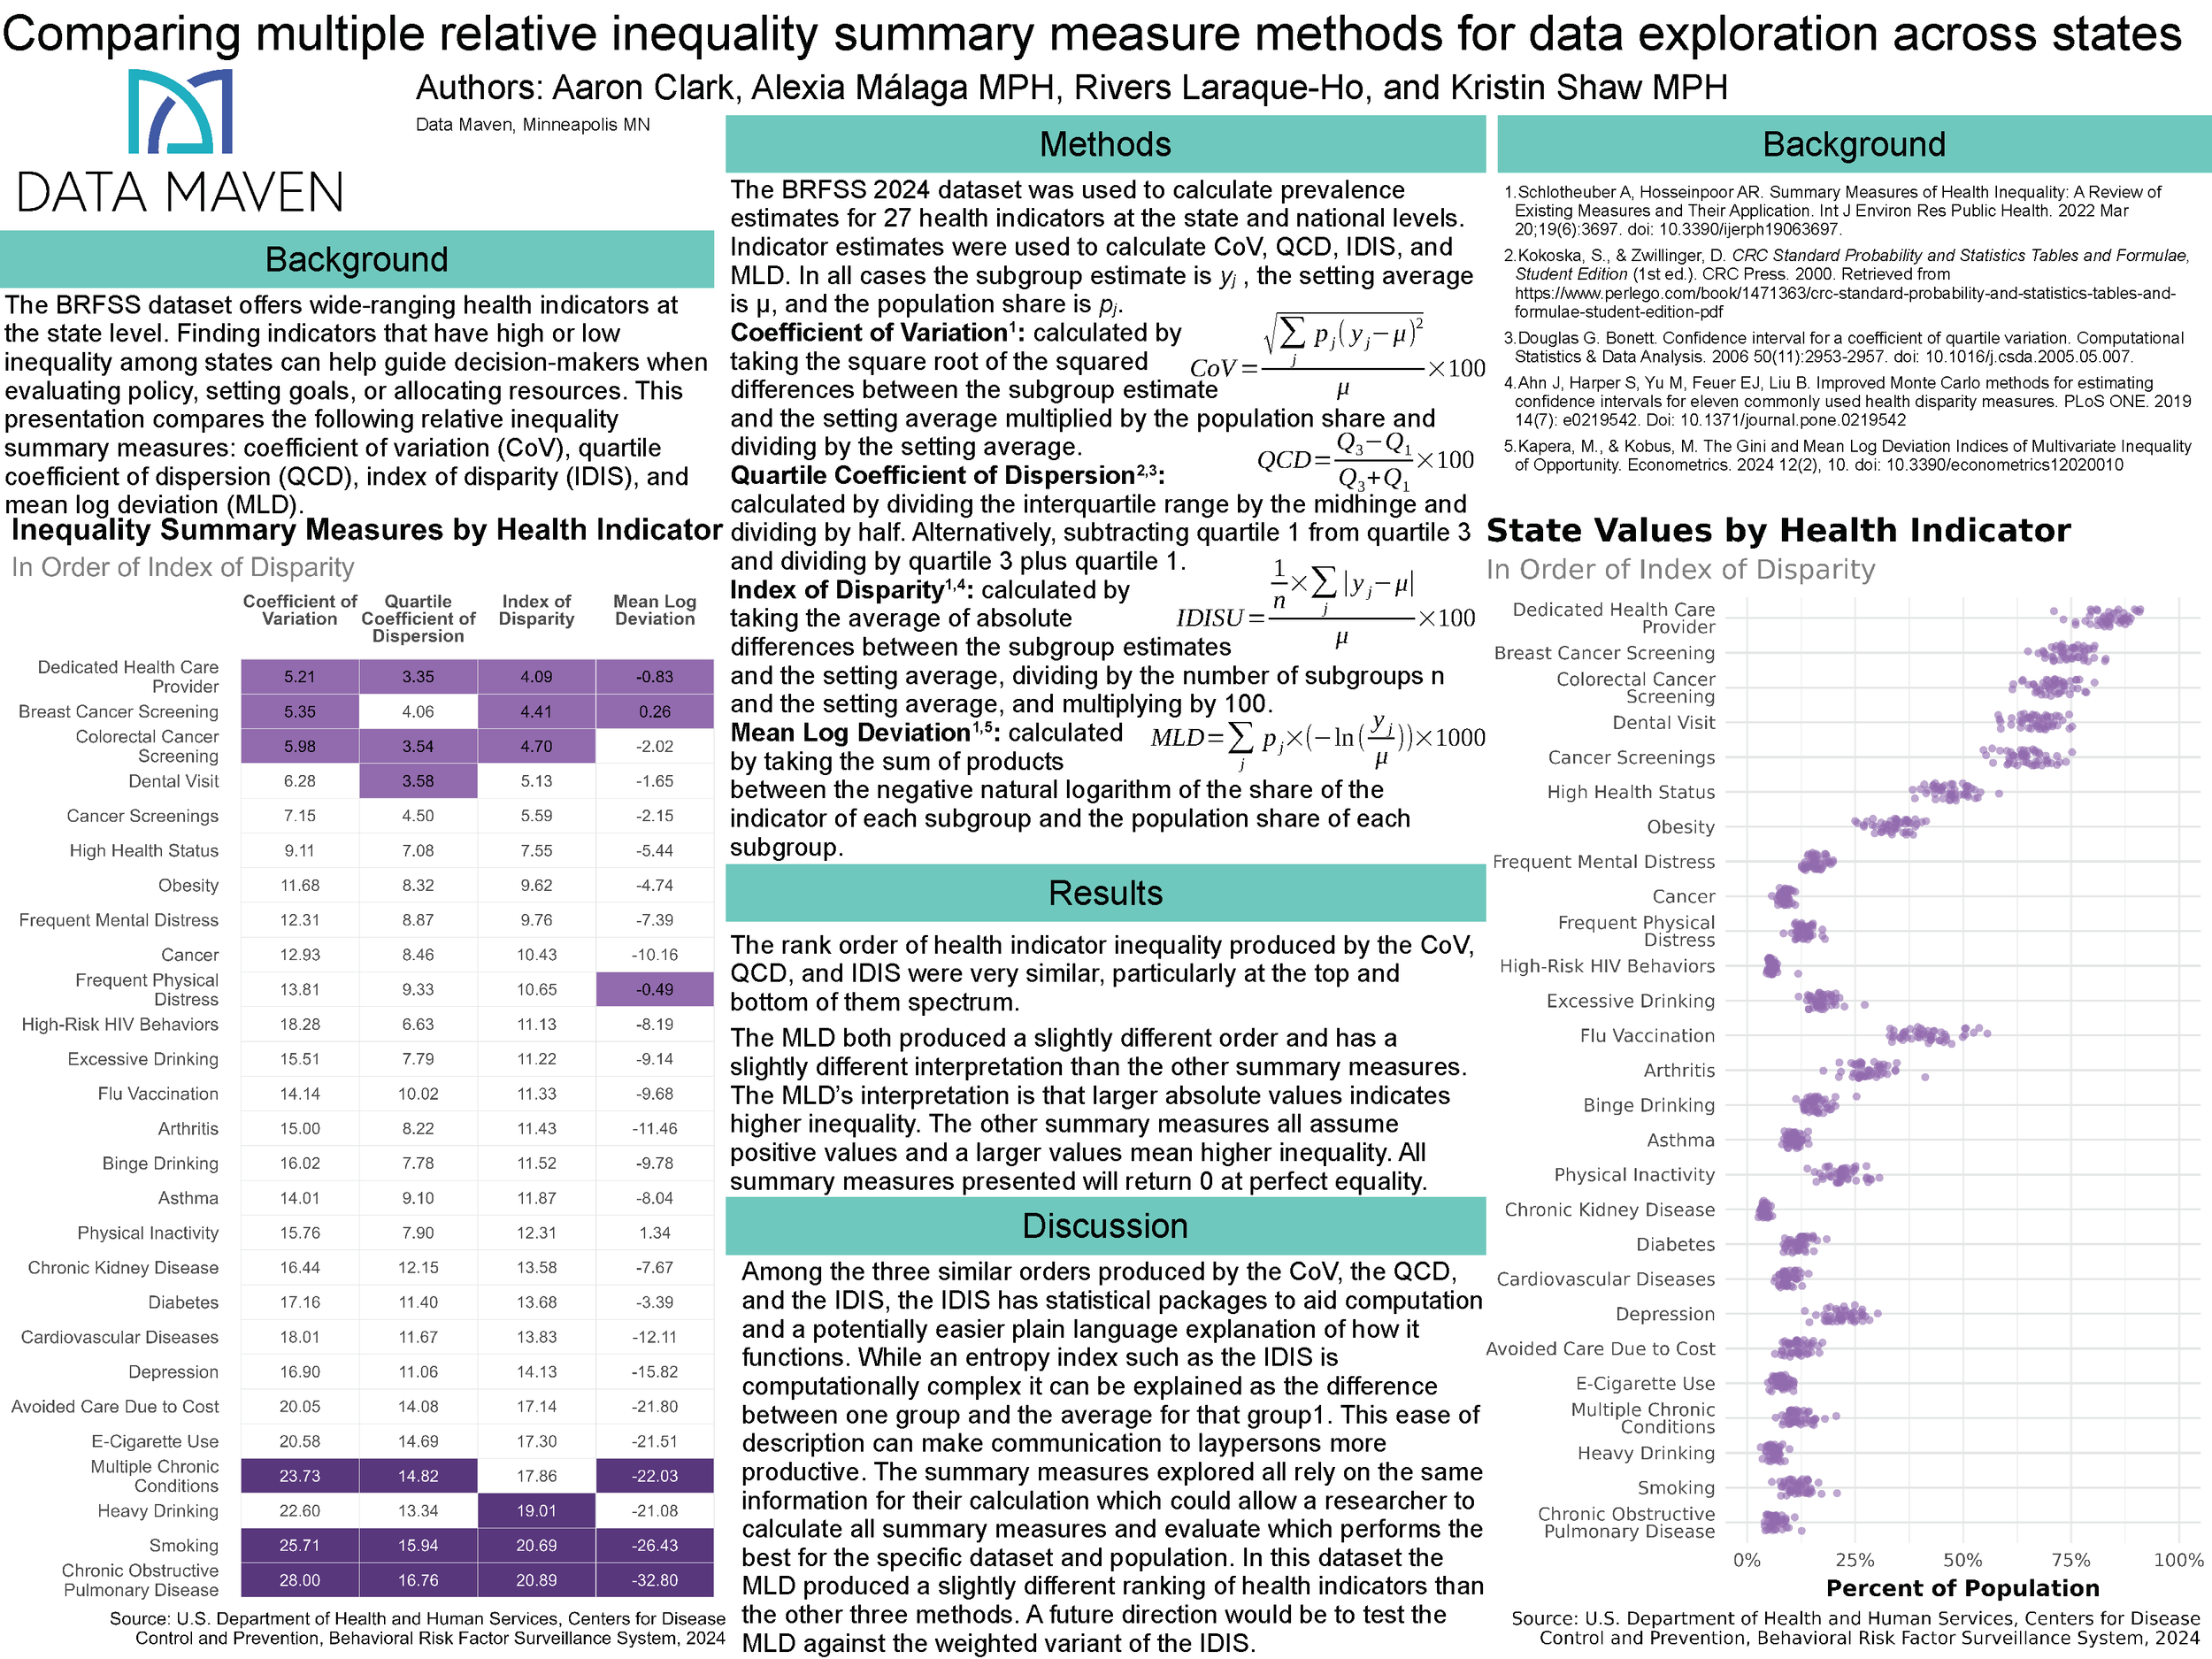
Comparing Multiple Relative Inequality Summary Measure Methods for Data Exploration Across States
Aaron Clark • 2026 BRFSS Annual Meeting
Aaron Clark
2026 Behavioral Risk Factor Surveillance System (BRFSS) Annual Meeting
Background
The BRFSS dataset offers wide-ranging health indicators at the state level. Finding indicators that have high or low inequality among states can help guide decision-makers when evaluating policy, setting goals, or allocating resources. This presentation compares the following relative inequality summary measures: coefficient of variation (CoV), quartile coefficient of dispersion (QCD), index of disparity (IDIS), and mean log deviation (MLD).
Objectives
To observe the performance of different relative inequality summary measures on BRFSS estimates and develop guidance.
Methods
The BRFSS 2024 dataset was used to calculate prevalence estimates for 27 health indicators at the state and national levels. Indicator estimates were used to calculate CoV, QCD, IDIS, and MLD. The three highest-inequality and three lowest-inequality indicators identified by each method were selected for comparison, along with three indicators from the midpoint.
Results
The indicators selected using CoV, QCD, IDIS, and MLD were highly similar to each other, with QCD, IDIS, and MLD each having one unique selection among the six indicators with the highest and lowest inequality. Almost all measures from the middle were unique.
Conclusions
CoV, QCD, IDIS, and MLD all performed similarly. This suggests that whichever summary measure is easiest to explain to the intended audience is likely the best choice, as none performed notably better in this sample. Modern computational capabilities also make it possible to perform all four summaries to compare the outcomes.
Tender Topics: Stories of Real Conversations on Vaccinations, Racism, and Identity
Alexia Málaga • 2026 MPHA Annual Conference
Alexia Málaga
2026 Minnesota Public Health Association (MPHA) Annual Conference • St. Cloud, MN
Description
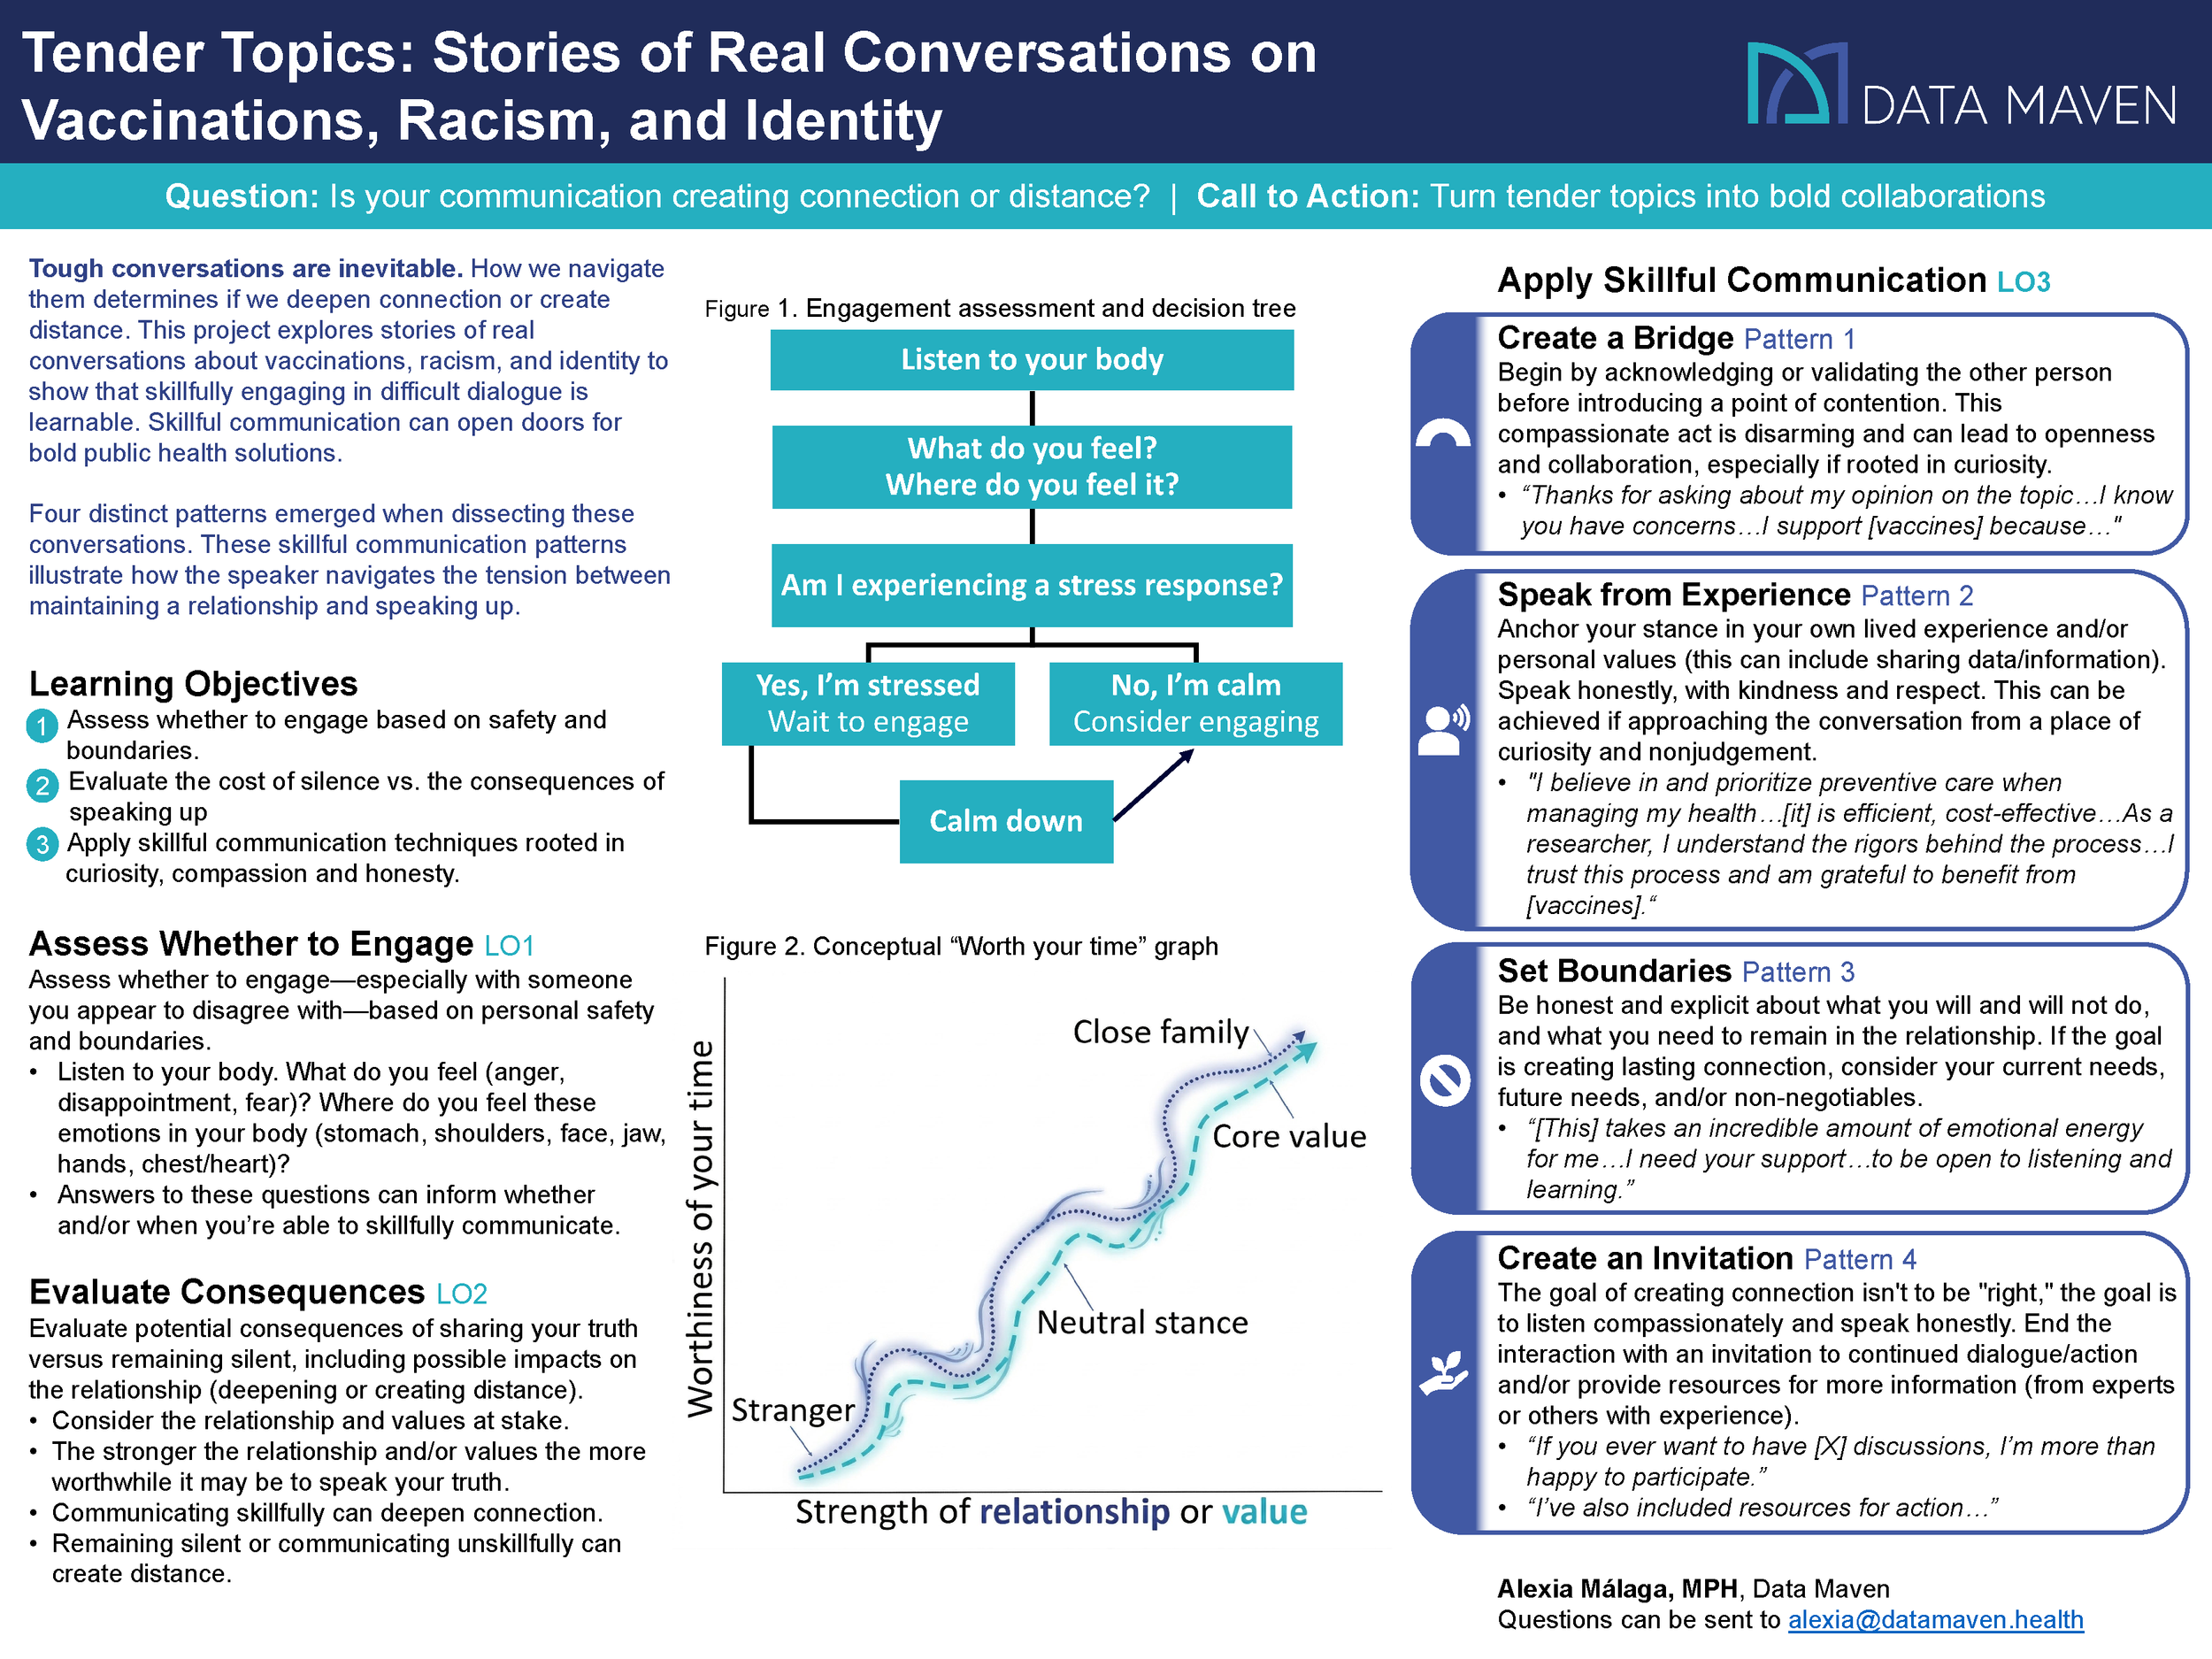
The key topic of this presentation is communications, with the main message being: tough conversations are inevitable, and how we navigate them can either deepen connection or create distance in relationships. Change begins with an idea, often acted on in coordination with others, and learning whether and how to engage in difficult dialogue—especially with people we appear to disagree with—is a skill. My hope is for attendees to be inspired by these success stories to speak their truth with honesty, compassion, and curiosity. This presentation aligns with the conference theme, Reimagining the Future of Public Health, by showing how skillfully engaging in tough conversations about tender public health topics can build healthier relationships and open new opportunities for collaboration, bold ideas, and real solutions.
Learning Objectives
Determine whether or not to engage in a difficult dialogue—especially with someone you appear to disagree with—after assessing personal safety needs and boundaries.
Evaluate potential consequences of sharing your truth versus remaining silent, including possible impacts on the relationship (deepening or creating distance).
Apply this demonstrated approach for communicating with honesty, compassion and curiosity around tender public health topics.
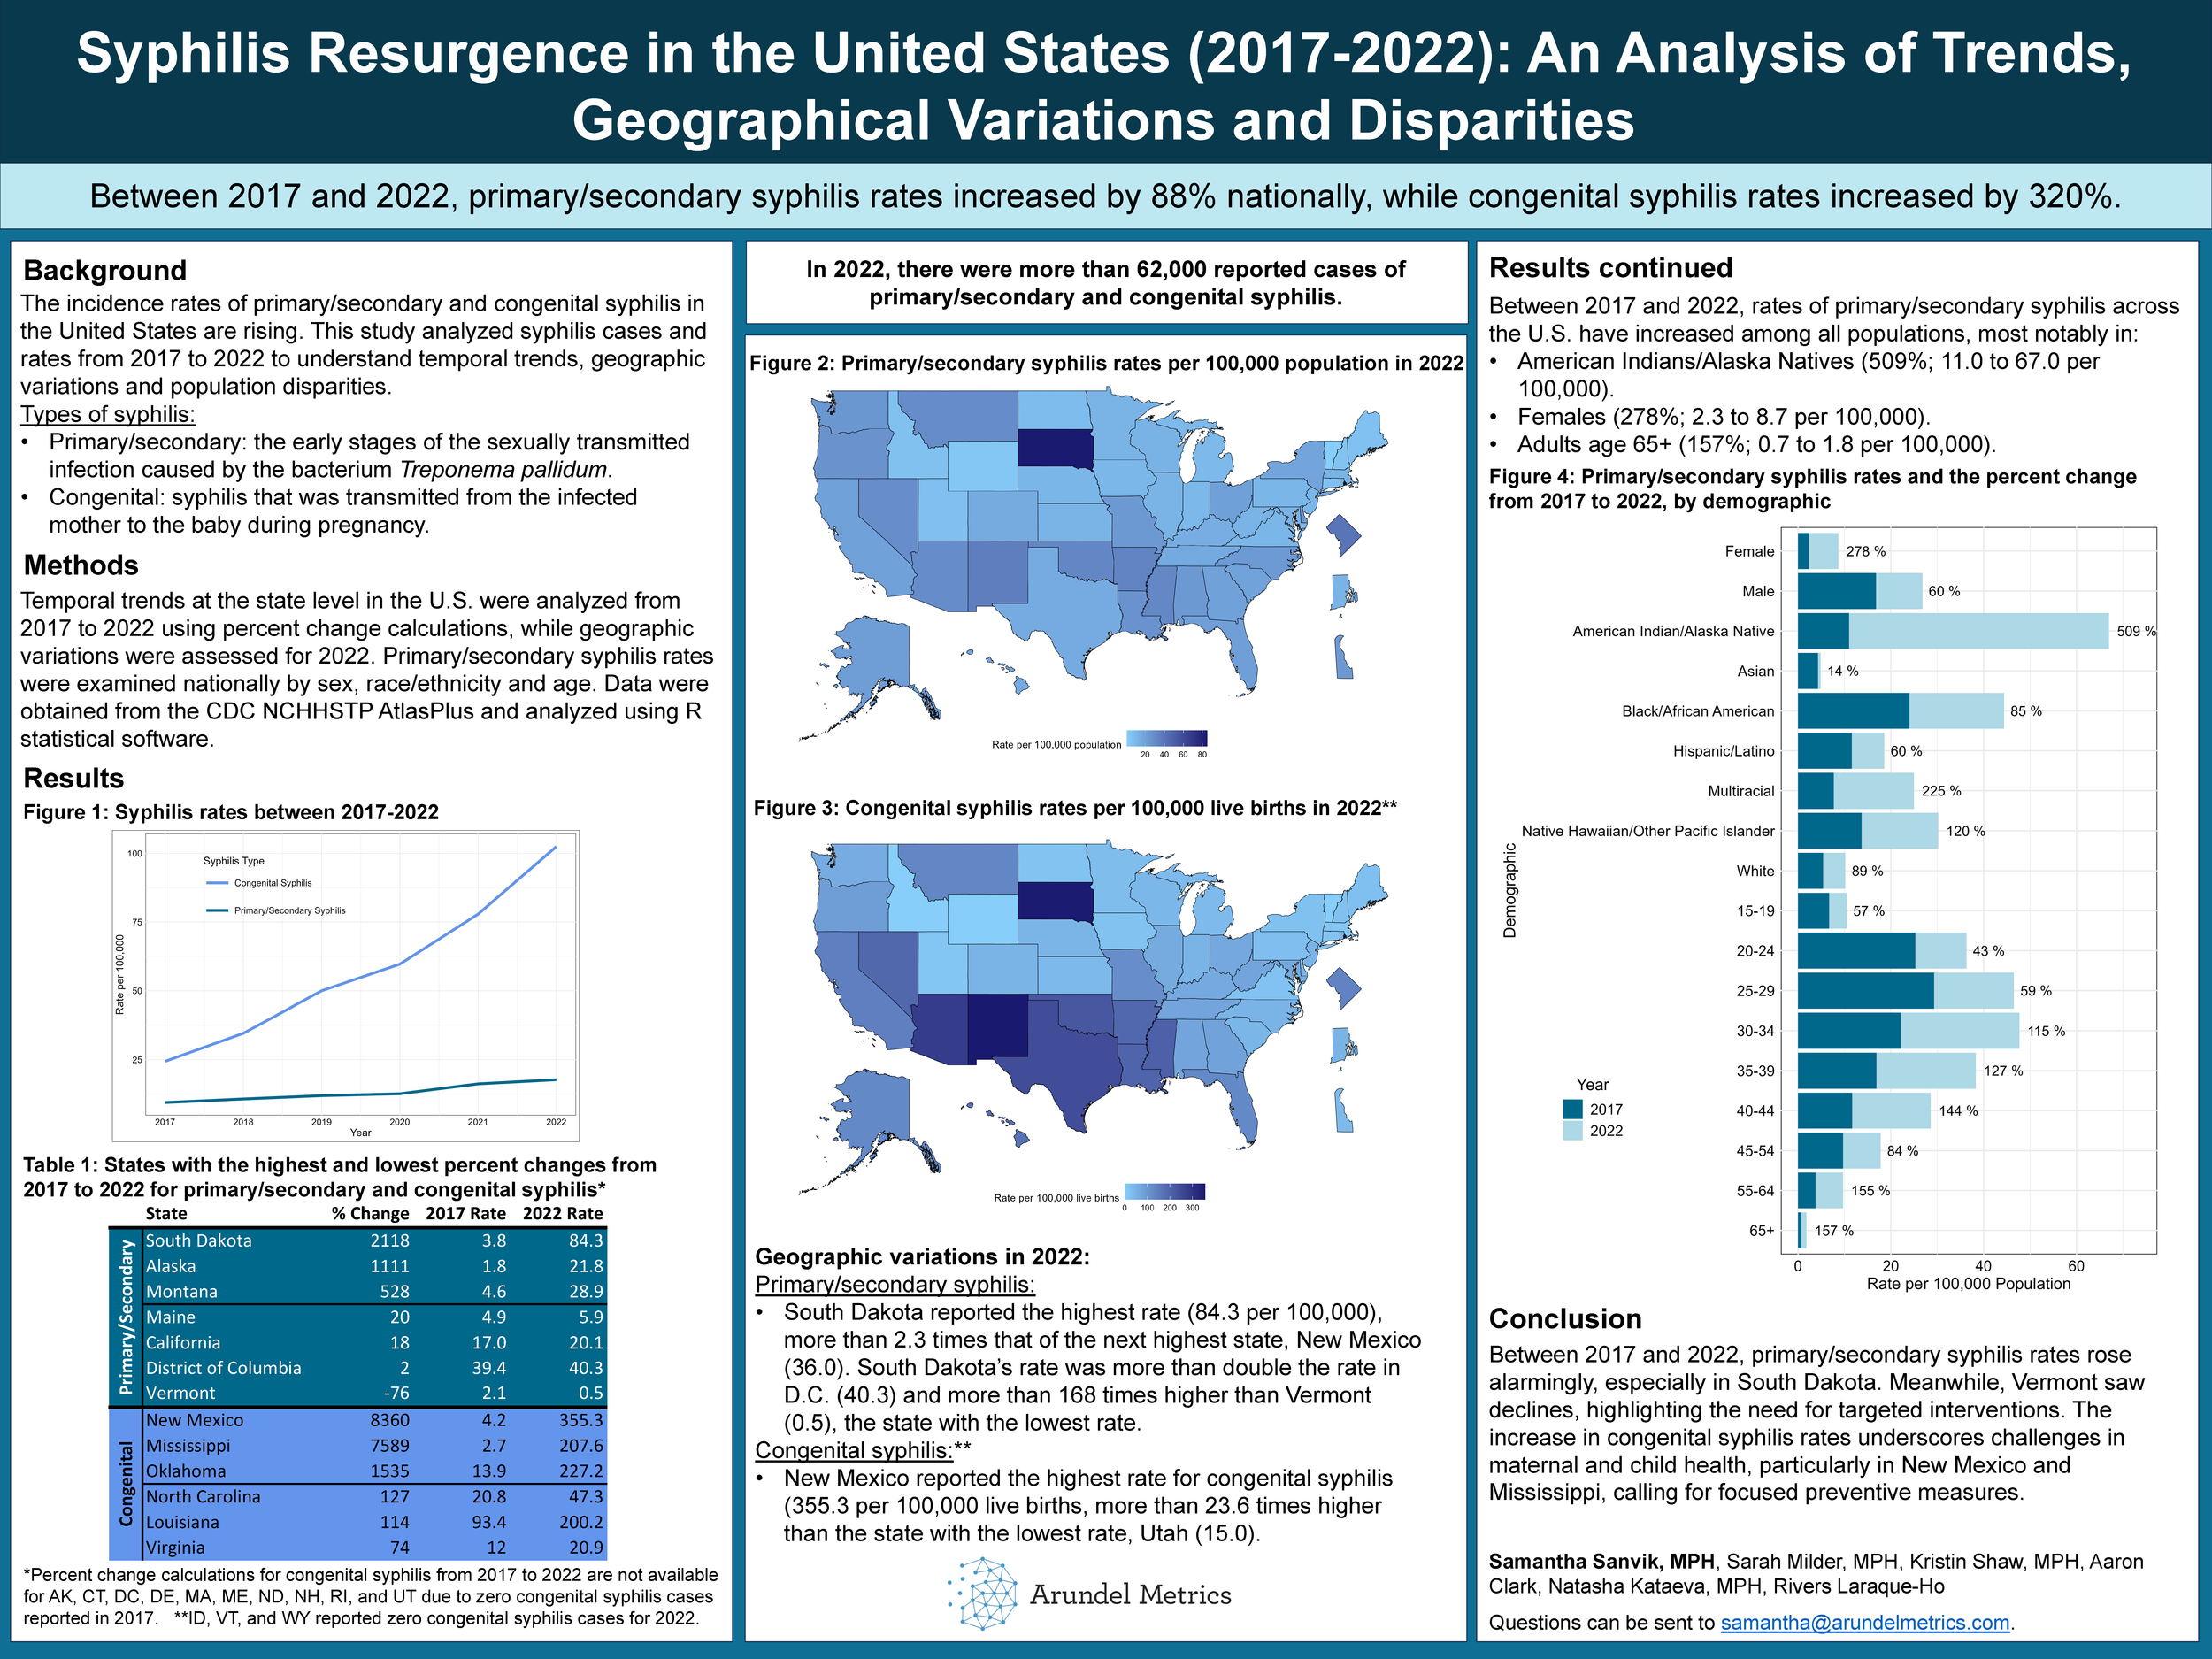
Syphilis Resurgence in the United States (2017-2022): An Analysis of Trends, Geographic Variations and Disparities
Samantha Liv • 2024 CSTE Annual Conference
Samantha Liv
2024 Council of State and Territorial Epidemiologists (CSTE) Annual Conference • Pittsburgh, PA
Background
The rising incidence of primary, secondary and congenital syphilis across the United States presents significant public health challenges. This study analyzed syphilis cases and rates from 2017 to 2021, aiming to provide an understanding of the temporal trends, geographical variations and population disparities associated with the resurgence in sexually transmitted infections.
Methods
U.S. state-level temporal trends were analyzed from 2017 to 2021 via percent change calculations and geographic variations were assessed for the year 2021. Primary and secondary syphilis rates were analyzed by age, race/ethnicity and sex at the national level. Data was obtained from the CDC NCHHSTP AtlasPlus and analysis was performed using R statistical software.
Results
Temporal trends from 2017 to 2021 showed primary and secondary syphilis rate changes across the nation, the highest occurring in Alaska with a 1372% increase (1.8 to 26.5 per 100,000) and a decrease in two states and the District of Columbia (-3%; 39.4 to 38.4 per 100,000): Vermont (-33%; 2.1 to 1.4 per 100,000) and Maine (-10%; 4.9 to 4.4 per 100,000). Congenital syphilis rates increased in nearly all states. The highest increase was in Mississippi (6641%, 2.7 to 182.0 per 100,000) while the lowest increase occurred in Nebraska (5.1%; 3.9 to 4.1 per 100,000).
In 2021, South Dakota reported the highest rate of primary/secondary syphilis (48.7 per 100,000, 436 cases), while Vermont reported the lowest (1.4 per 100,000, 9 cases), highlighting regional variability. For congenital syphilis, Arizona faced the highest rate (232.3 per 100,000, 181 cases), while Maine, New Hampshire, and Wyoming reported zero cases, and Nebraska, Delaware and Vermont each reported 1 case (4.1, 9.5 and 18.6 per 100,000, respectively) in 2021.
Between 2017 and 2021, rates of primary and secondary syphilis across the U.S. have increased in all populations, notably for American Indians/Alaska Natives (325%; 11.0 to 46.7 per 100,000), females (217%; 2.3 to 7.3 per 100,000) and adults ages 65+ (114%; 0.7 to 1.5 per 100,000).
Conclusions
This study highlights syphilis trends in the United States from 2017 to 2021. Alarming increases in primary and secondary syphilis, particularly in Alaska, contrast with declines in Vermont, Maine, and D.C., necessitating targeted interventions. The surge in congenital syphilis, notably in Mississippi, underscores maternal and child health challenges, urging focused preventive measures. These findings emphasize the need for continued surveillance and targeted strategies to mitigate syphilis impact across diverse populations nationwide.
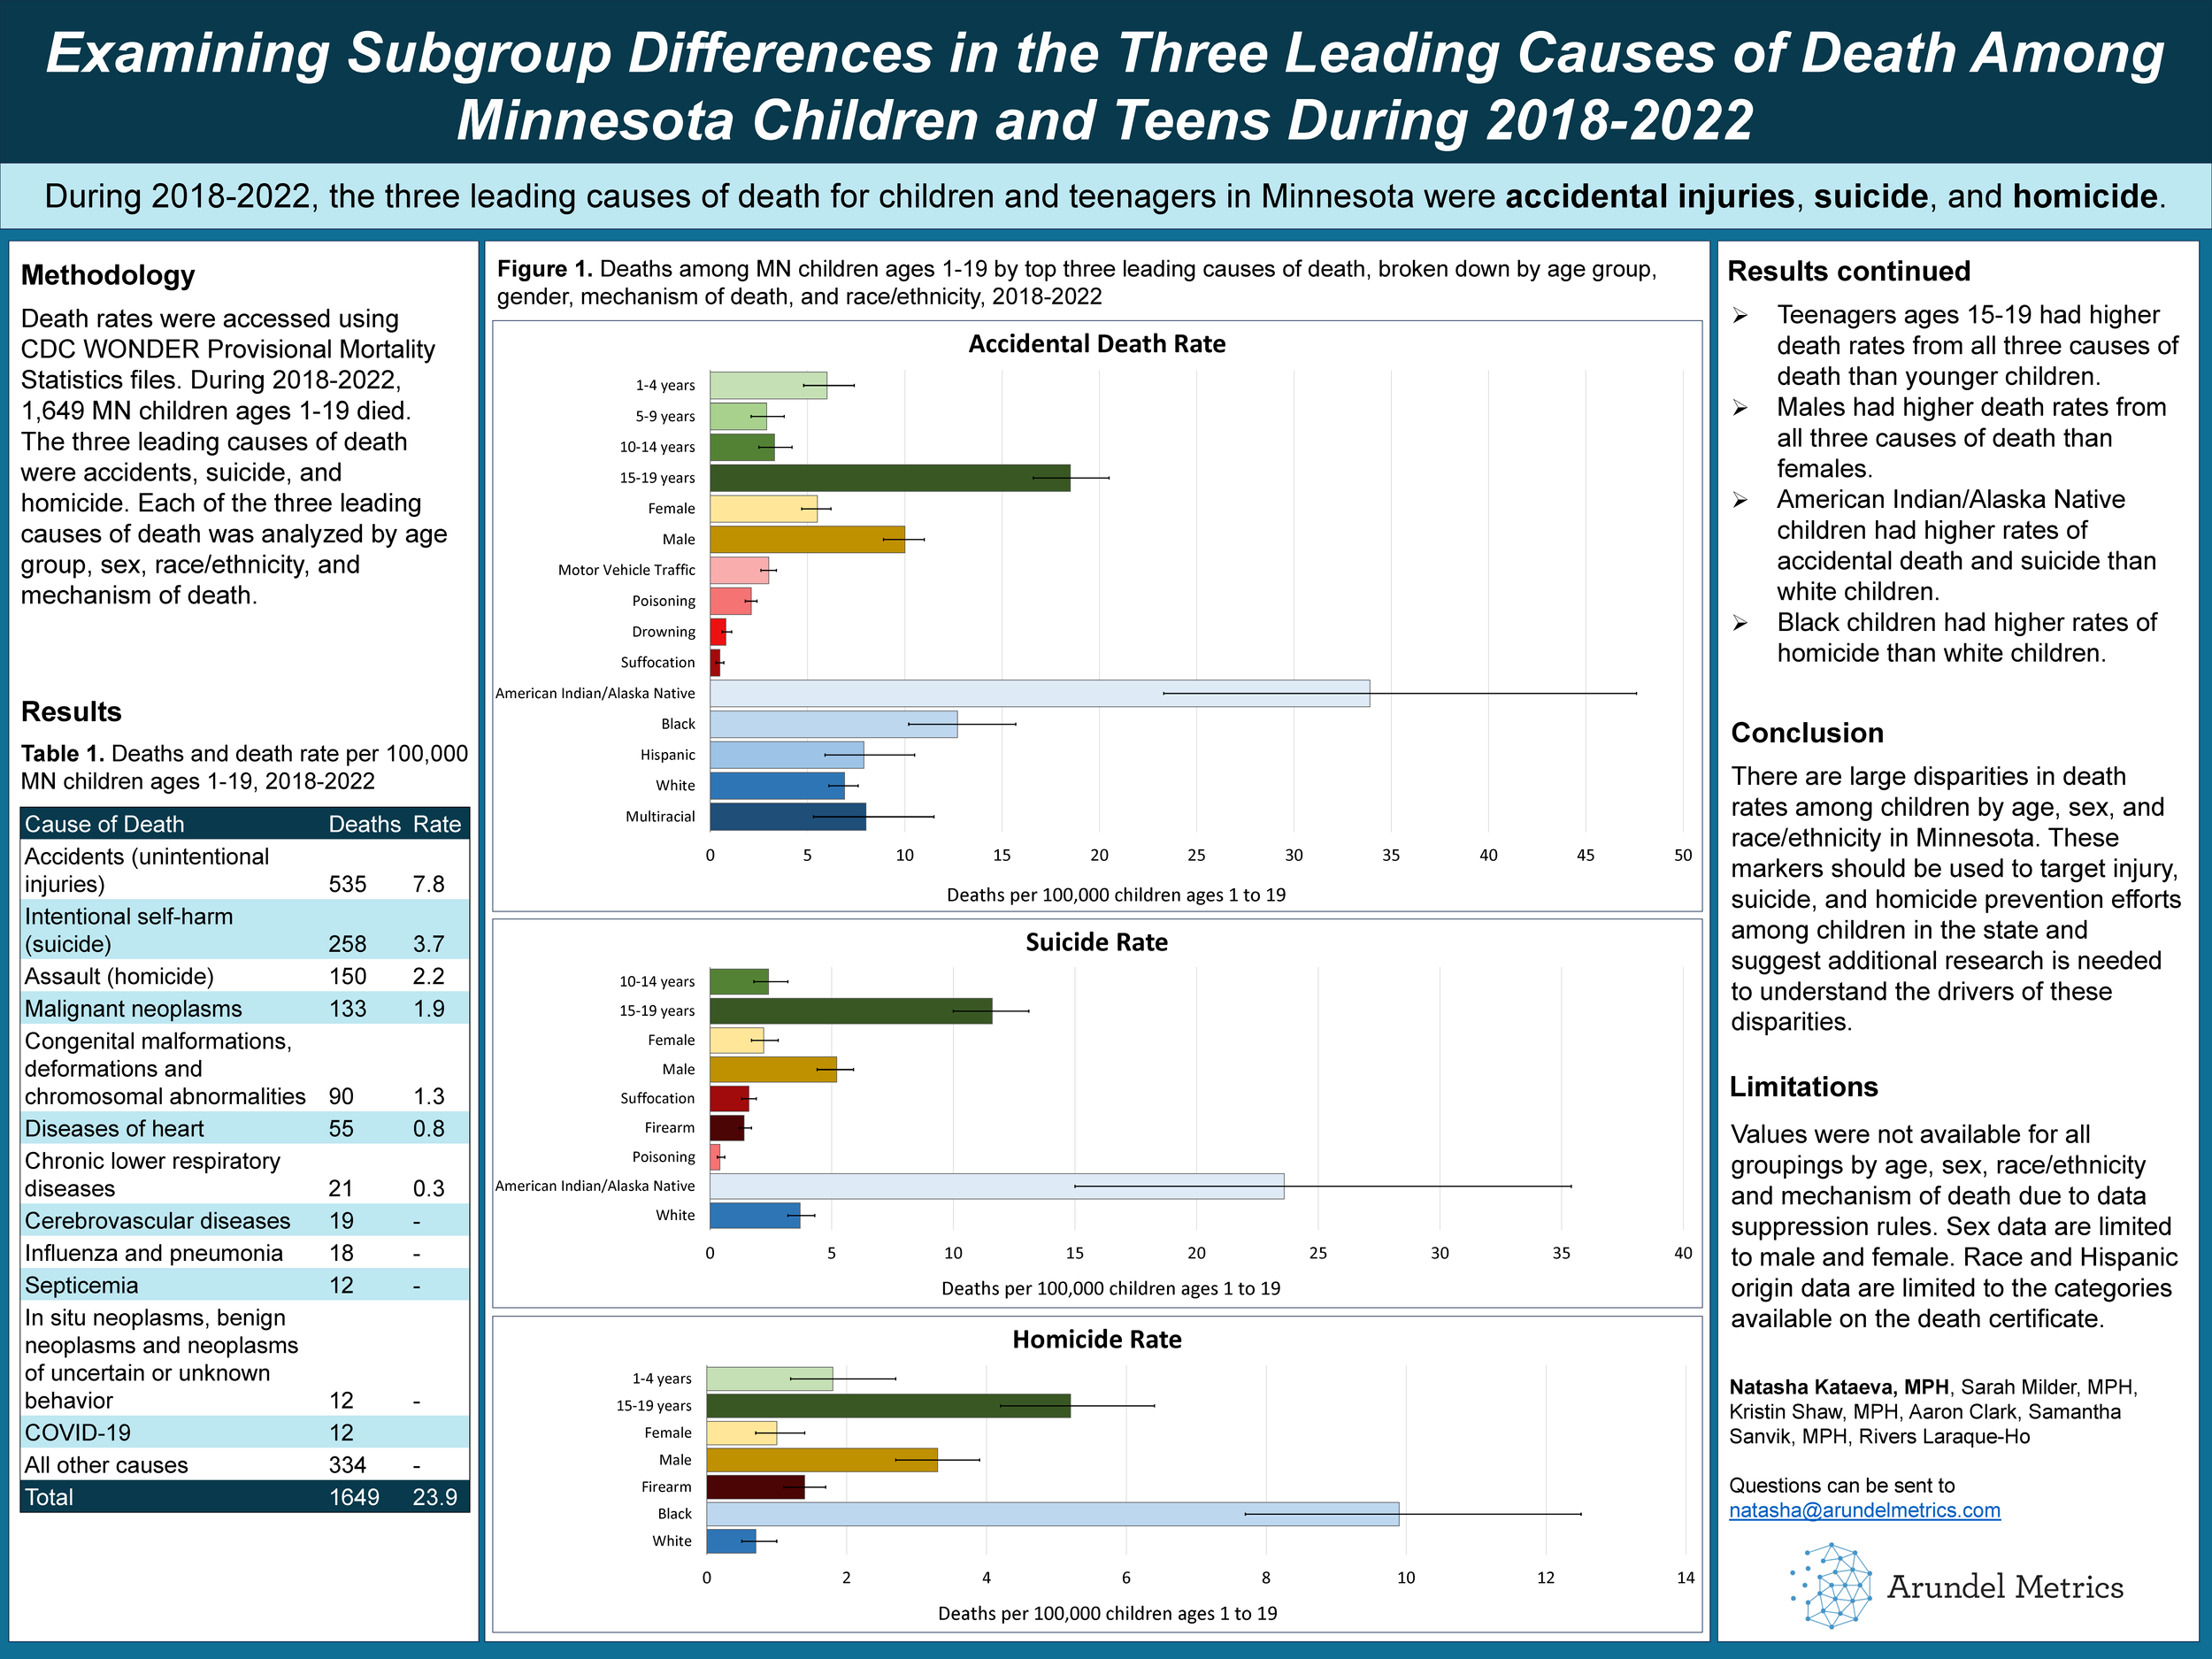
Examining Subgroup Differences in the Three Leading Causes of Death Among Minnesota Children and Teens During 2018-2022
Natasha Kataeva • 2024 MPHA Annual Conference
Natasha Kataeva
2024 Minnesota Public Health Association (MPHA) Annual Conference
Death rates were accessed using CDC WONDER Provisional Mortality Statistics files. In 2018-2022, 1,315 MN children ages 1-19 died. The three leading causes of death were accidents (535), suicide (258), and homicide (150). Each cause of death was analyzed by age group, sex, race/ethnicity, and mechanism of death.
The accidental death rate was 7.8 per 100,000. Motor vehicle traffic accidents were the most common mechanism. The rate was highest among 15-19 year olds (18.5), males (10.0), and American Indian/Alaska Native children.
The suicide rate was 3.7 per 100,000. Suffocation was the most common mechanism. The death rate was highest among 15-19 year olds, males (5.2), and American Indian/Alaska Native children (23.6).
The homicide rate was 2.2 per 100,000. Firearms were the most common mechanism. The death rate was highest among 15-19 year olds (5.2), males (3.3), and Black children (9.9).
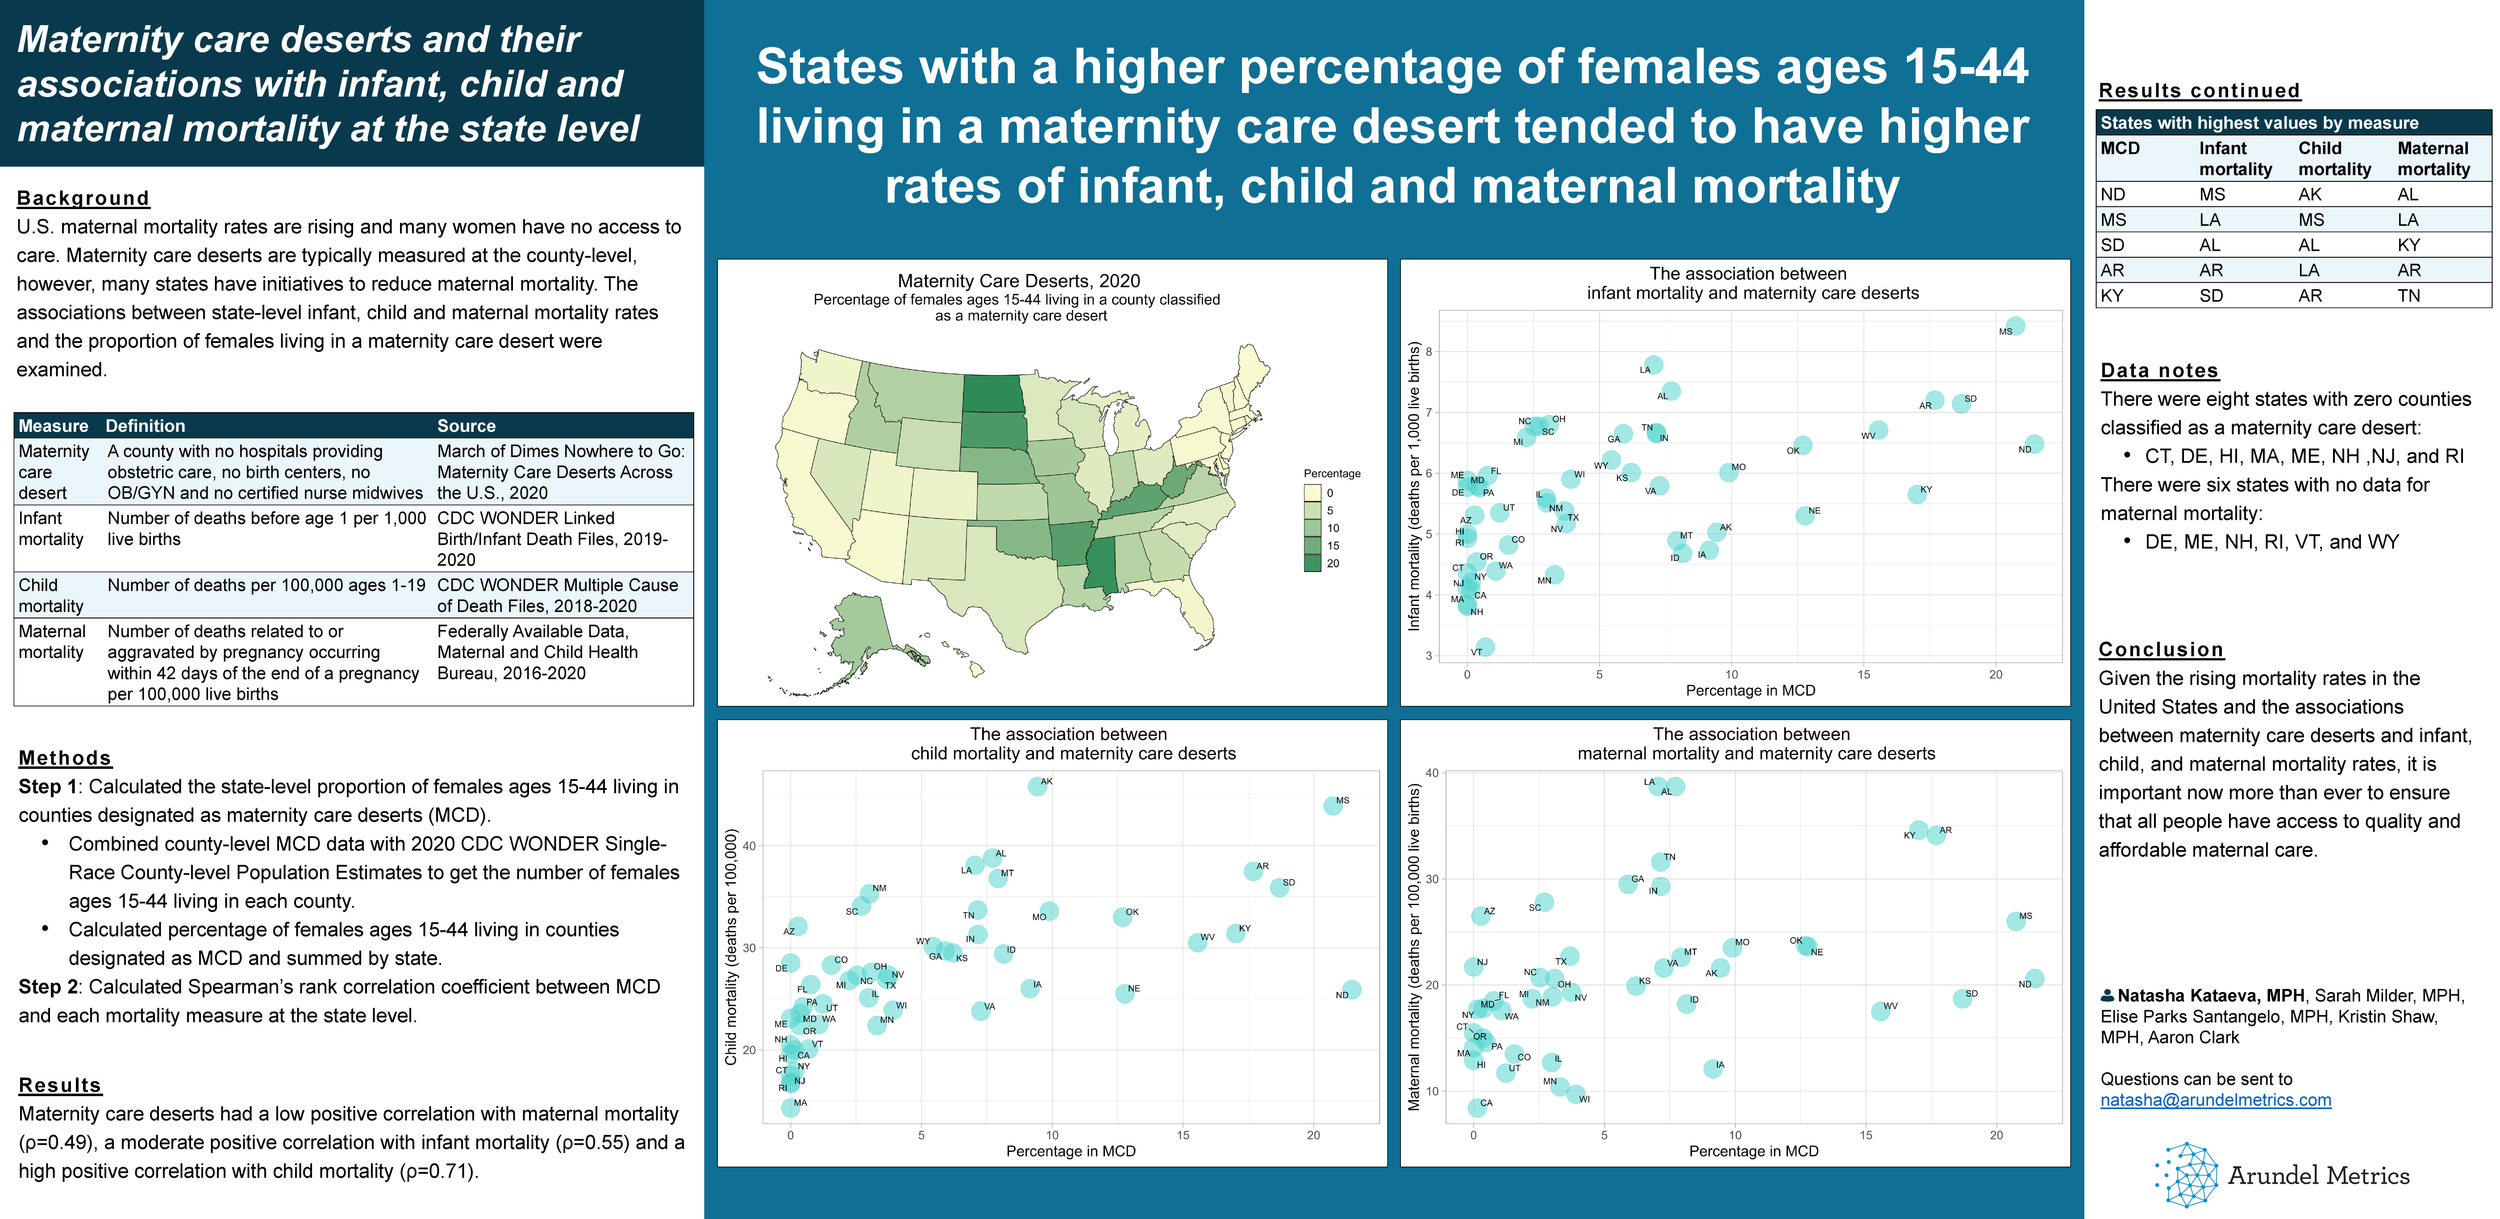
Maternity Care Deserts and Their Associations With Infant, Child and Maternal Mortality at the State Level
Natasha Kataeva • 2023 APHA Annual Meeting and Expo
Natasha Kataeva
2023 American Public Health Association (APHA) Annual Meeting and Expo
Background
U.S. maternal mortality rates are rising and many women have no access to care. Maternity care deserts are typically measured at the county-level, however, many states have initiatives to reduce maternal mortality. The associations between state-level infant, child and maternal mortality rates and the proportion of females living in a maternity care desert were examined.
Methods
The state-level proportion of females ages 15-44 living in a maternity care desert (county with no hospitals providing obstetric care, no birth centers, no OB/GYN and no certified nurse midwives) was calculated using 2020 March of Dimes and CDC WONDER Single-Race Population Estimates data. State-level children (deaths per 100,000 ages 1-19), infant (deaths before age 1 per 1,000 live births) and maternal (deaths related to or aggravated by pregnancy, excluding accidental or incidental causes occurring within 42 days of the end of a pregnancy per 100,000 live births) mortality rates were calculated from 2018-2020 CDC WONDER, Multiple Cause of Death Files; 2019-2020 Linked Birth/Infant Death Files; and 2016-2020 Federally Available Data, Maternal and Child Health Bureau, respectively.
Results
Maternity care deserts had a low positive correlation with maternal mortality (r=0.49), a moderate positive correlation with infant mortality (r=0.55) and a high positive correlation with child mortality (r=0.71).
Conclusion
States with a higher percentage of females living in maternity care deserts tended to have higher rates of maternal, infant and child mortality. More research is needed to unpack the relationship between maternity care deserts and mortality.